Weekly Viz 2025-06-16
California Wildfire 1987-2023 I saw on the news last week that the smoke from wildfire in Canada significantly impacted air quality in Central and Southern ...
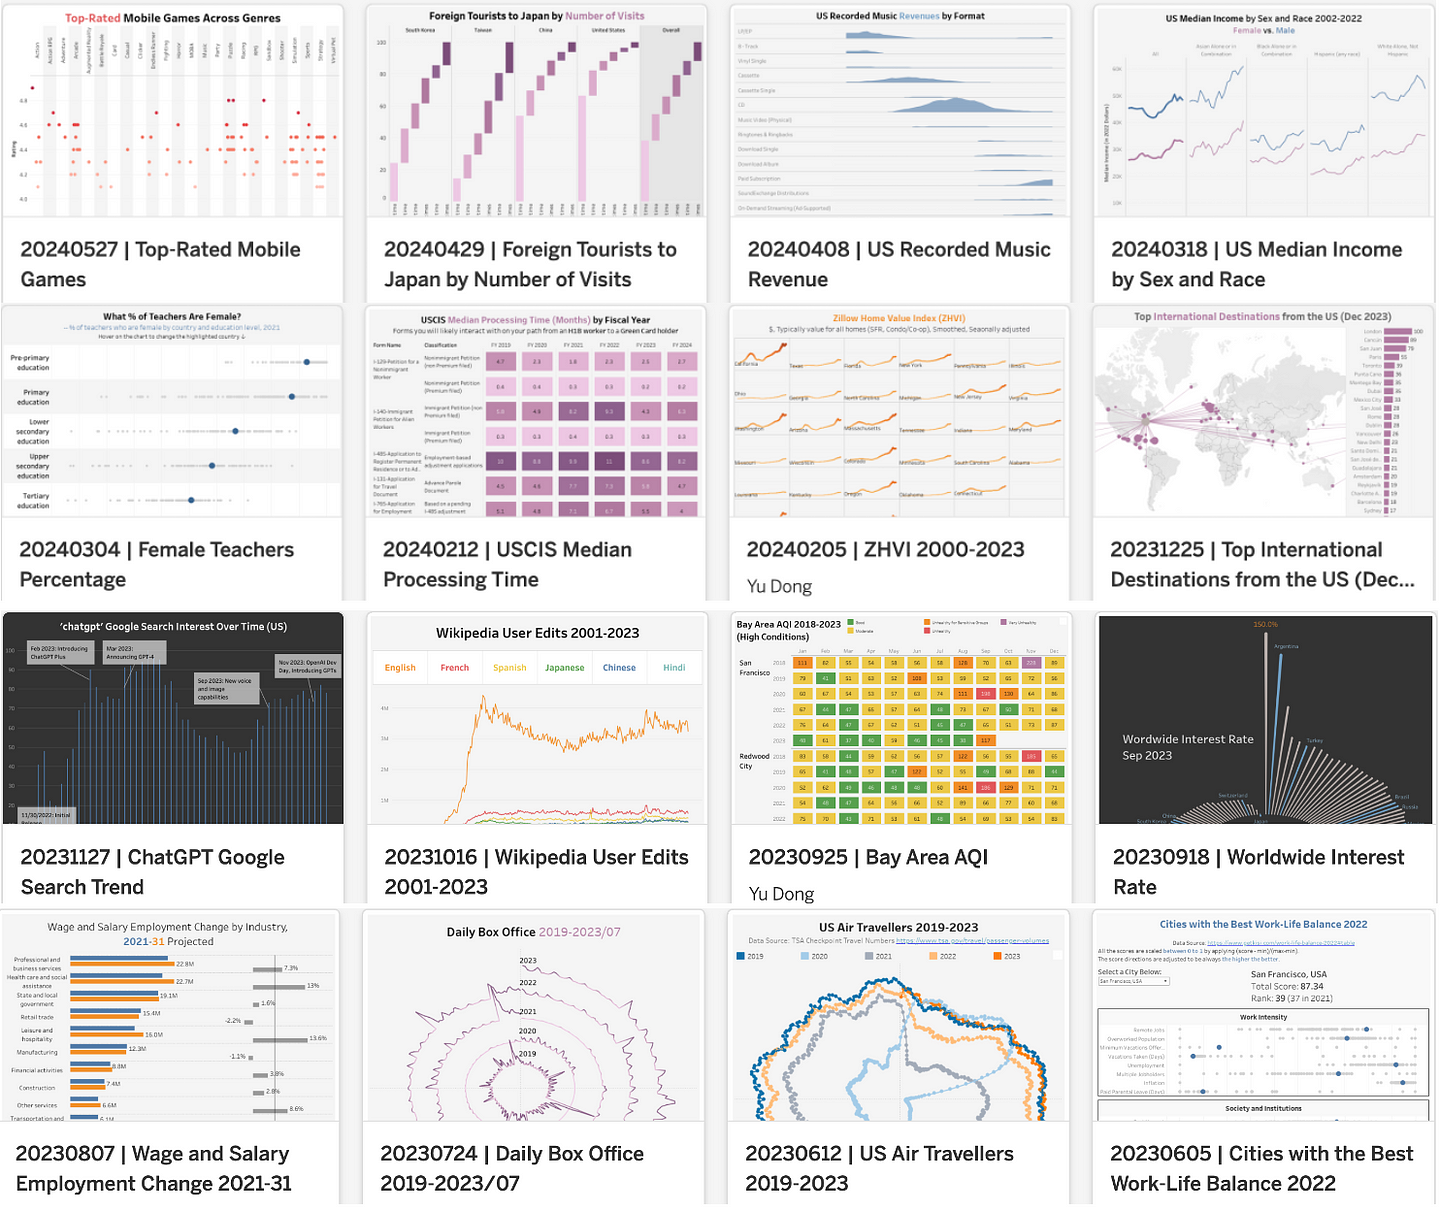
This is my eighth year of this weekly visualization project, which I began in 2018 when I started my first full-time job. The goal is to visualize a real-wor...
PTO Americans vs. Europeans I have always heard that Europeans have longer PTOs than Americans. But is that true? And if true, how much longer? This week I ...
This article was initially posted on Towards Data Science. From eliminating low-value tasks to accelerating high-impact projects, here’s how AI is resha...
California Electricity Generation Fuel Mix California has entered the no-rain summer season. Great sunshine with long daytime hours means plenty of solar en...
US Government Telework Rate The dataset I am visualizing this week is published on The Economics Daily by the U.S. Bureau of Labor Statistics. It shows an i...
Top 10 Busiest Airports Worldwide 2009-2024 My visualization this week is the busiest airports in the world (Wikipedia). It measures the airports with the h...
Asian American Demographics To celeborate the AANHPI Heritage Month, the dataset I am visualizing this week is the Asian American demographics data, includi...
Asian Restaurants in the US This month is the Asian American, Native Hawaiian, and Pacific Islander (AANHPI) Heritage Month in the US. Therefore, the datase...
My Medium Articles! In the past two months, I continued writing articles per month on Medium and Towards Data Science. Here you go: Google’s Data Science...