
Boost Your Data Analysis with the New ChatGPT Desktop App
Context
OpenAI launched its desktop App earlier this month.
“For both free and paid users, we’re also launching a new ChatGPT desktop app for macOS that is designed to integrate seamlessly into anything you’re doing on your computer. With a simple keyboard shortcut (Option + Space), you can instantly ask ChatGPT a question. You can also take and discuss screenshots directly in the app.”
I downloaded the app yesterday to try it out. At first glance, it looked like a simple replication of the web version, but I soon realized why it could effectively “integrate seamlessly into anything you’re doing on your computer.”
In the section below, I will walk you through a quick example of how to use it to assist with your data analysis work.
Extract Info from a Webpage
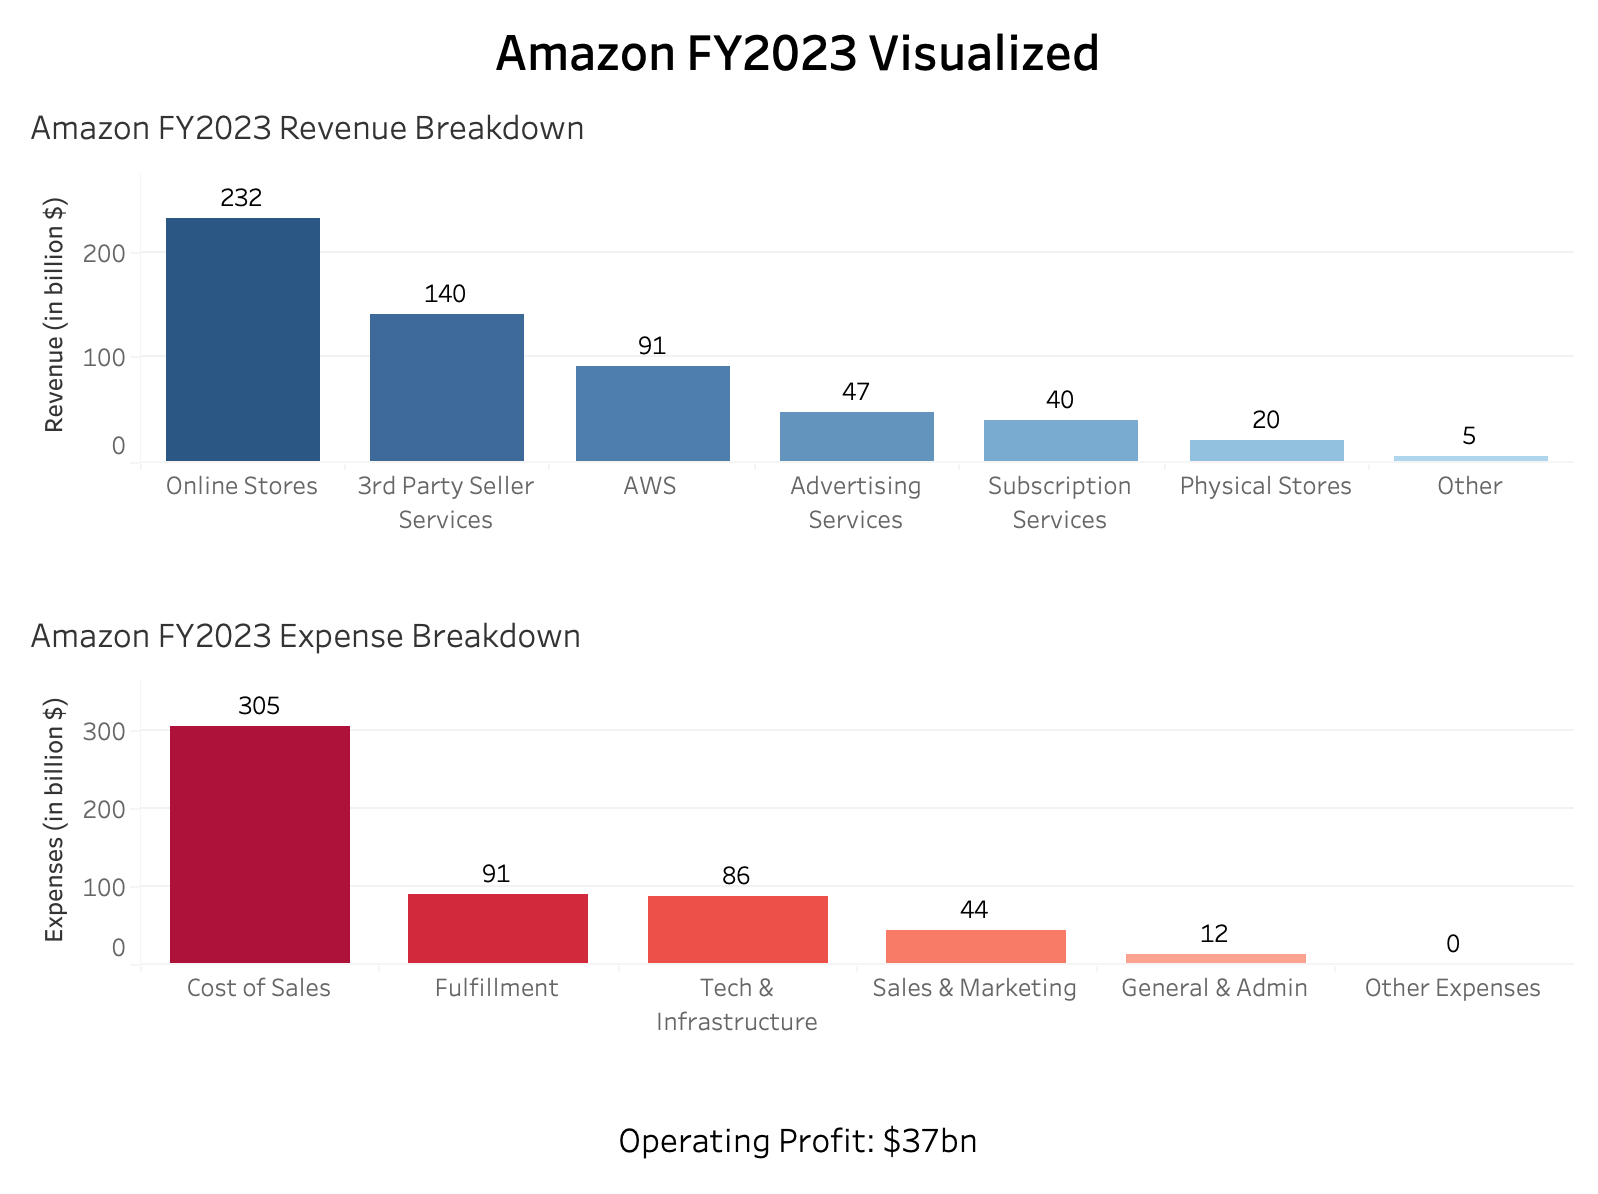
I started with a visualization of Amazon’s FY23 financial numbers from the Chartr Newsletter. It is an elegant Sankey diagram that explains the main sources of Amazon’s revenue and expenses, but not one of those common visualization types. Therefore, I decided to share it with GPT and ask it to explain the chart.
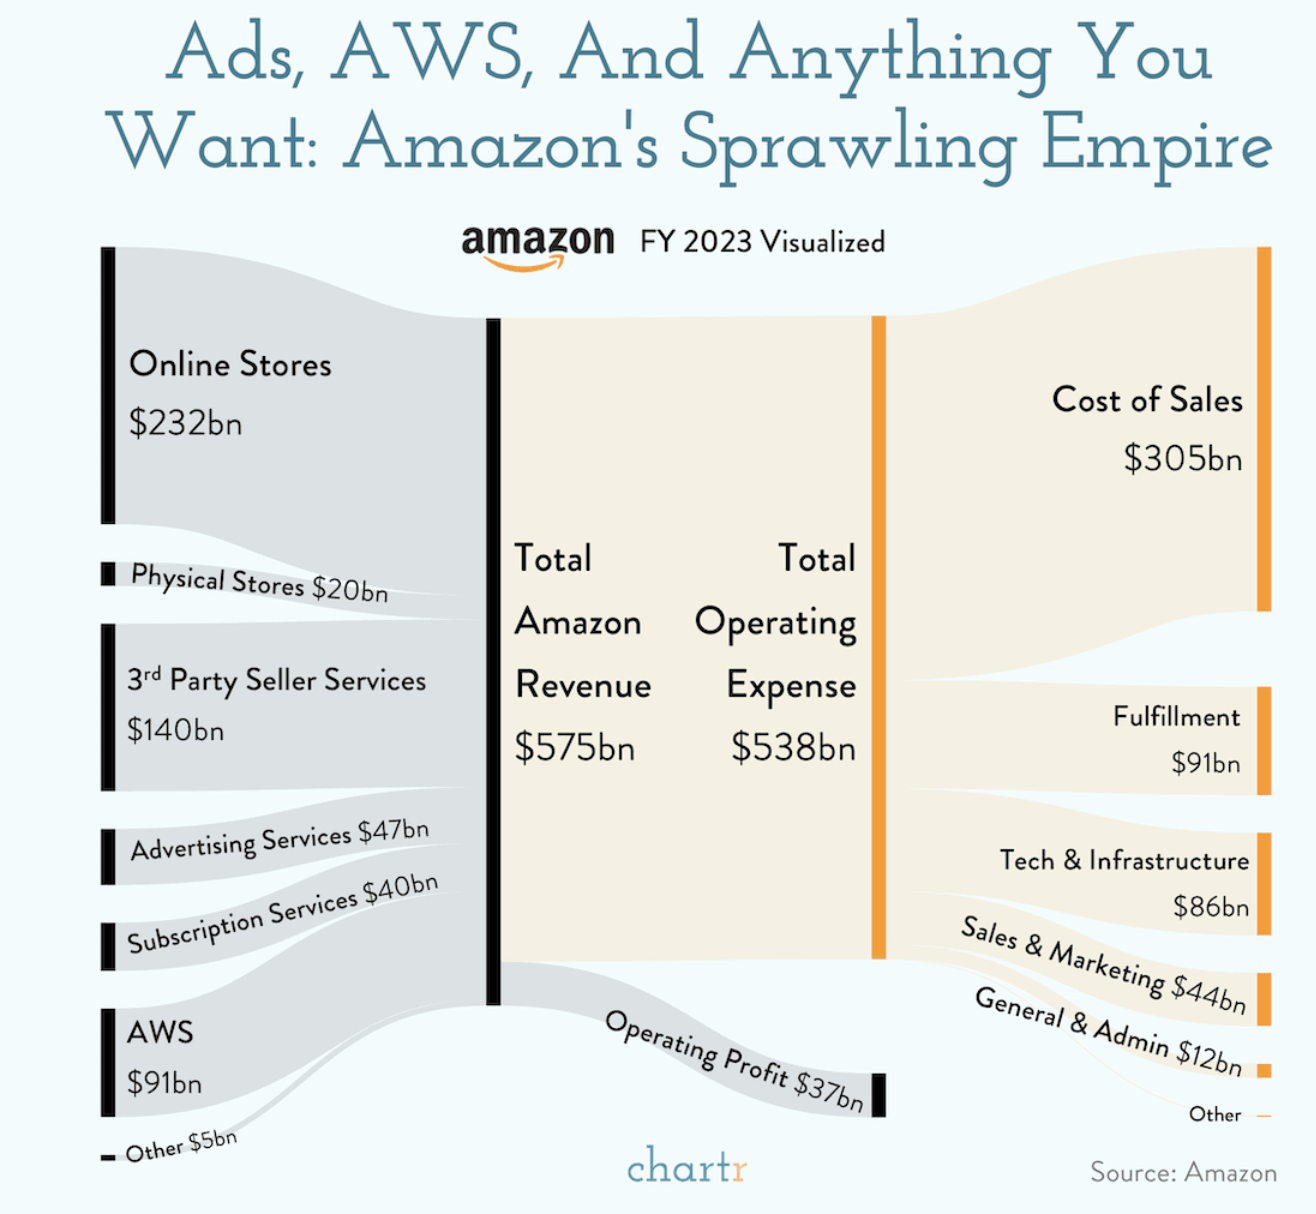
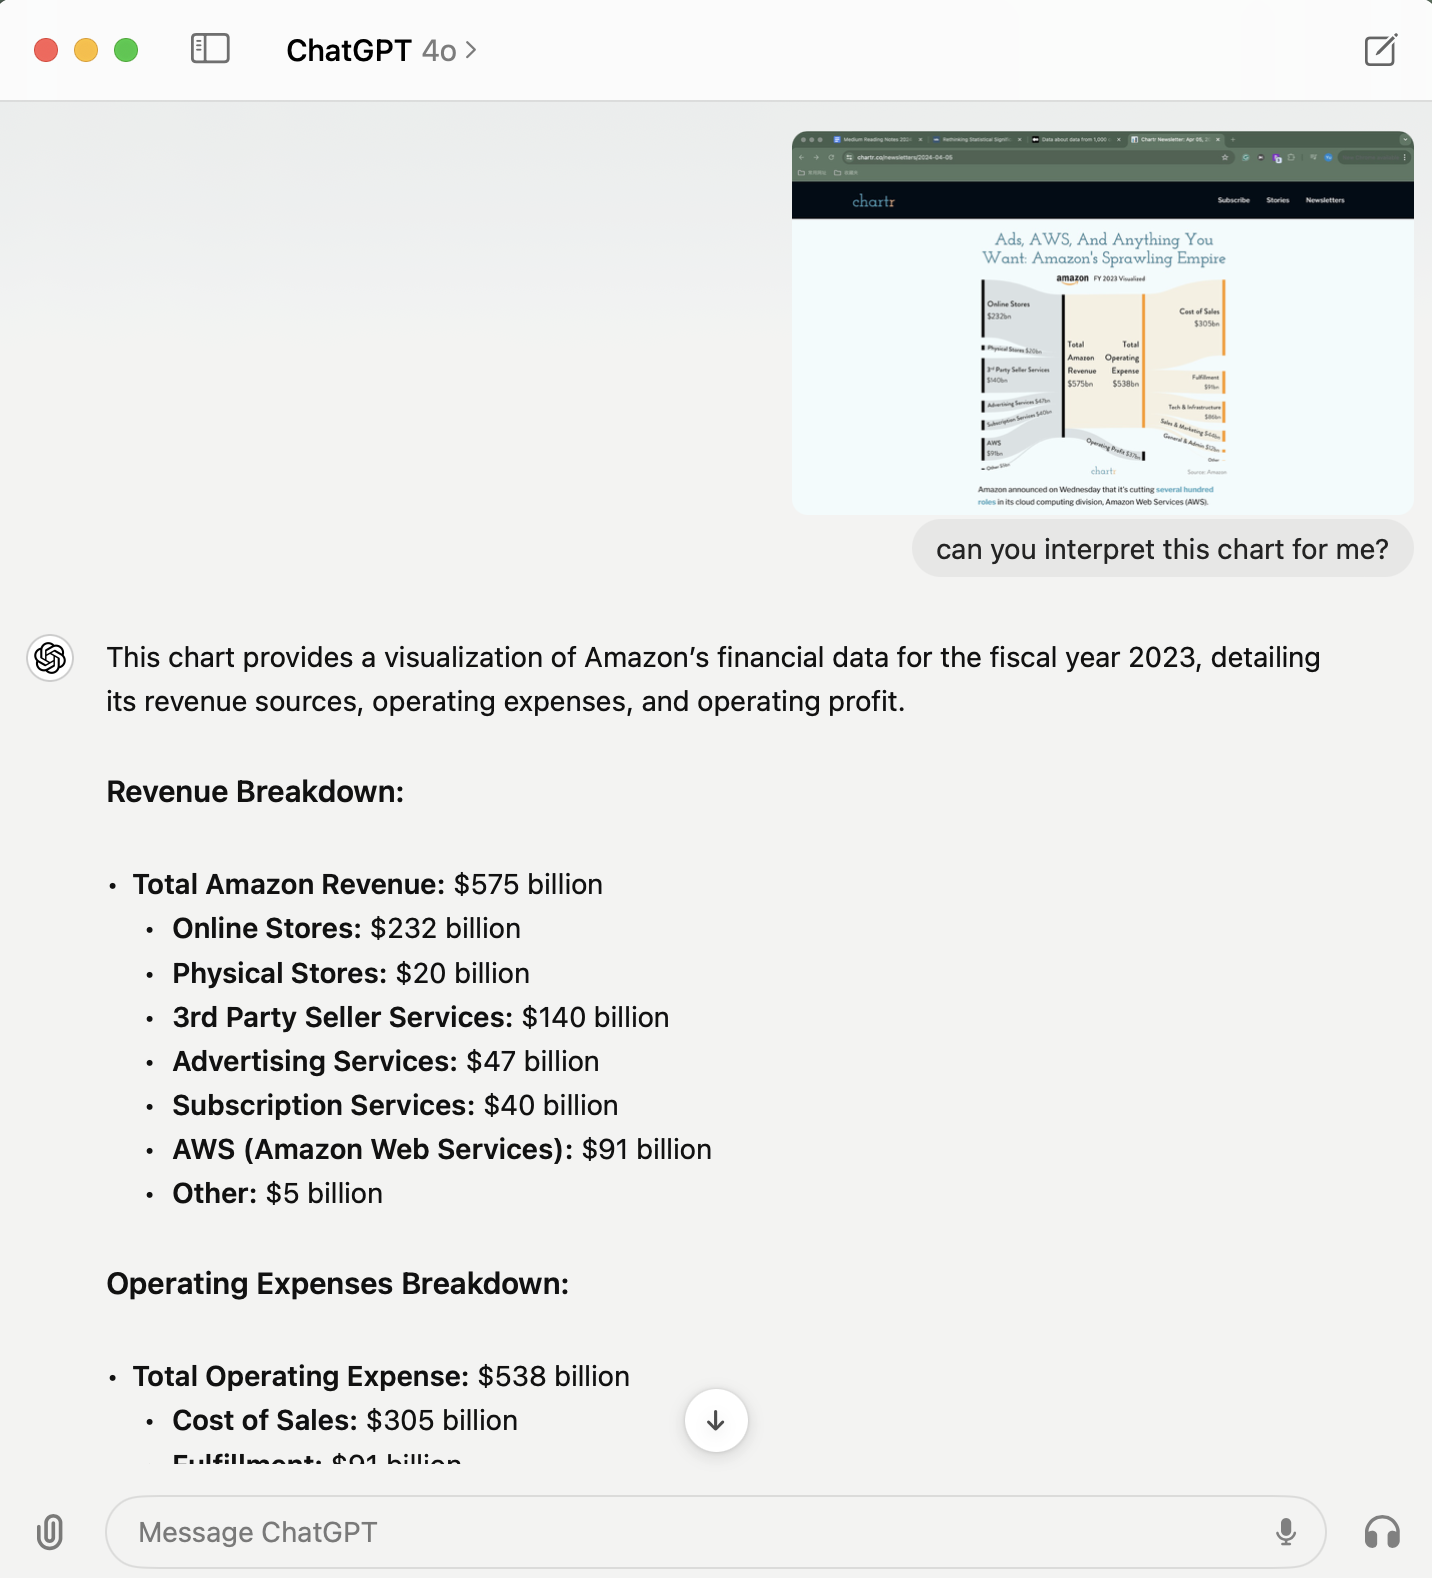
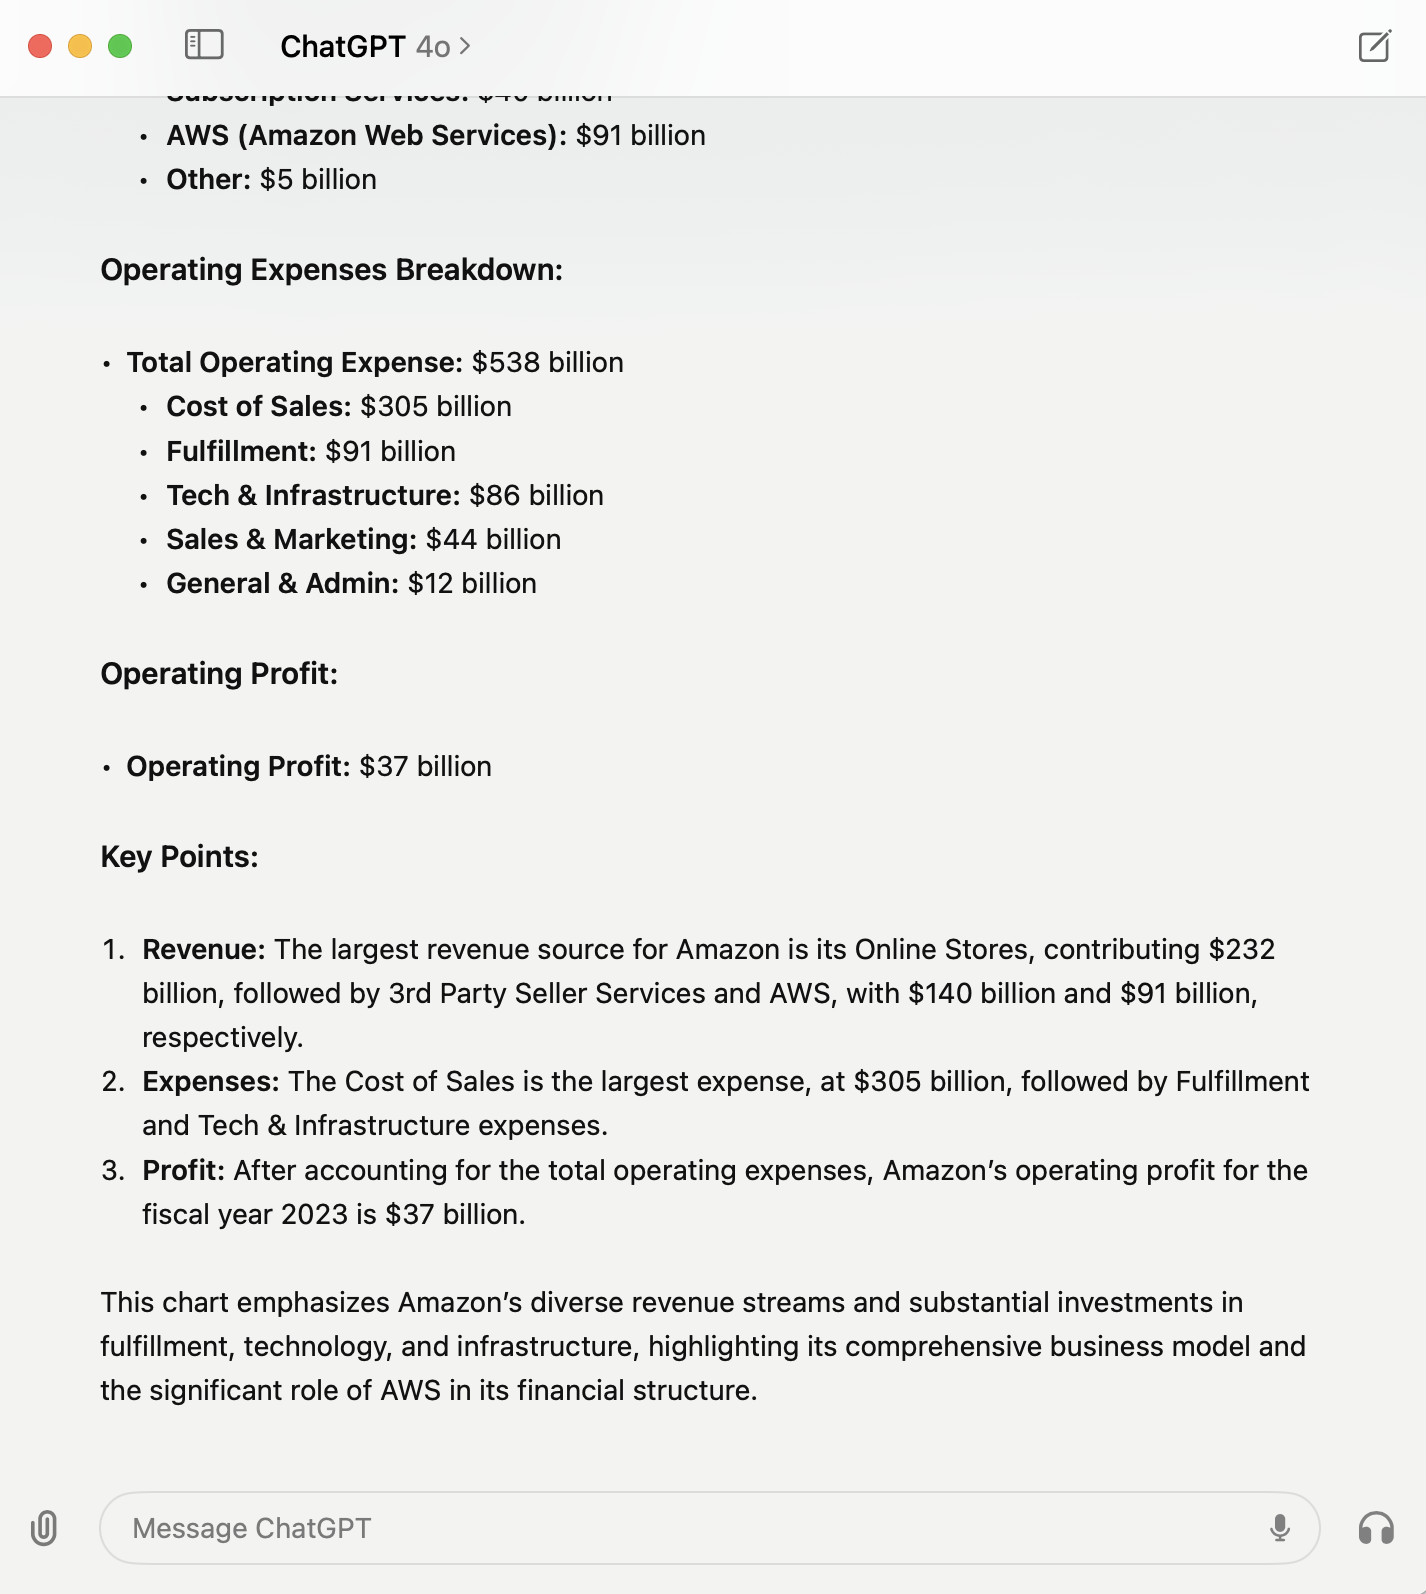
Using the keyboard shortcut (Option + Space) to open the GPT app and clicking ‘Take Screenshot’ of the browser was simple. GPT immediately provided a very accurate and detailed explanation of the chart, even highlighting key insights. I particularly liked how it called out ‘the significant role of AWS in Amazon’s financial structure.’
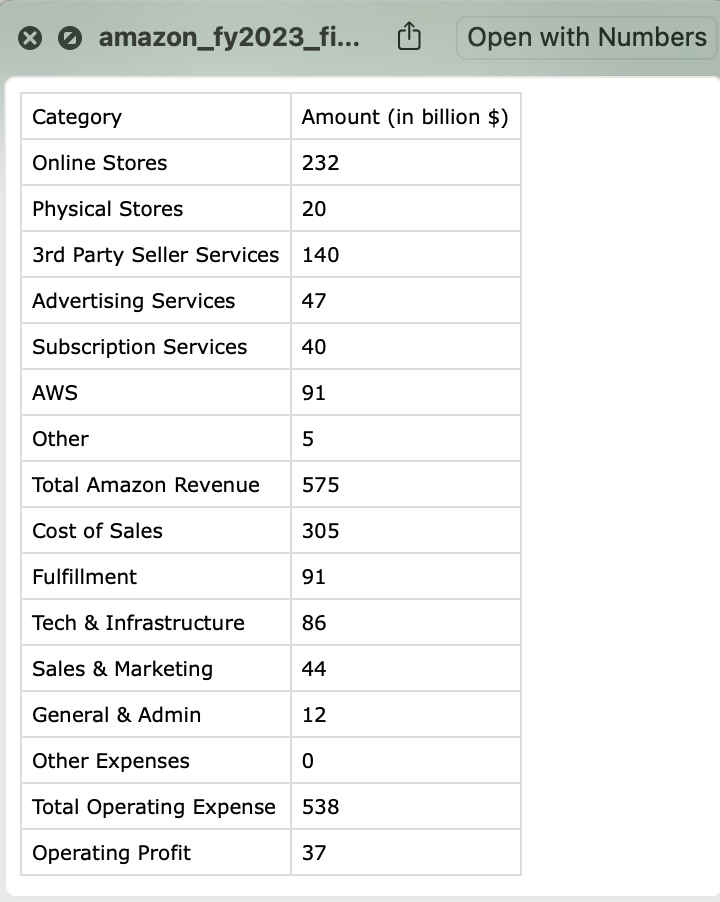
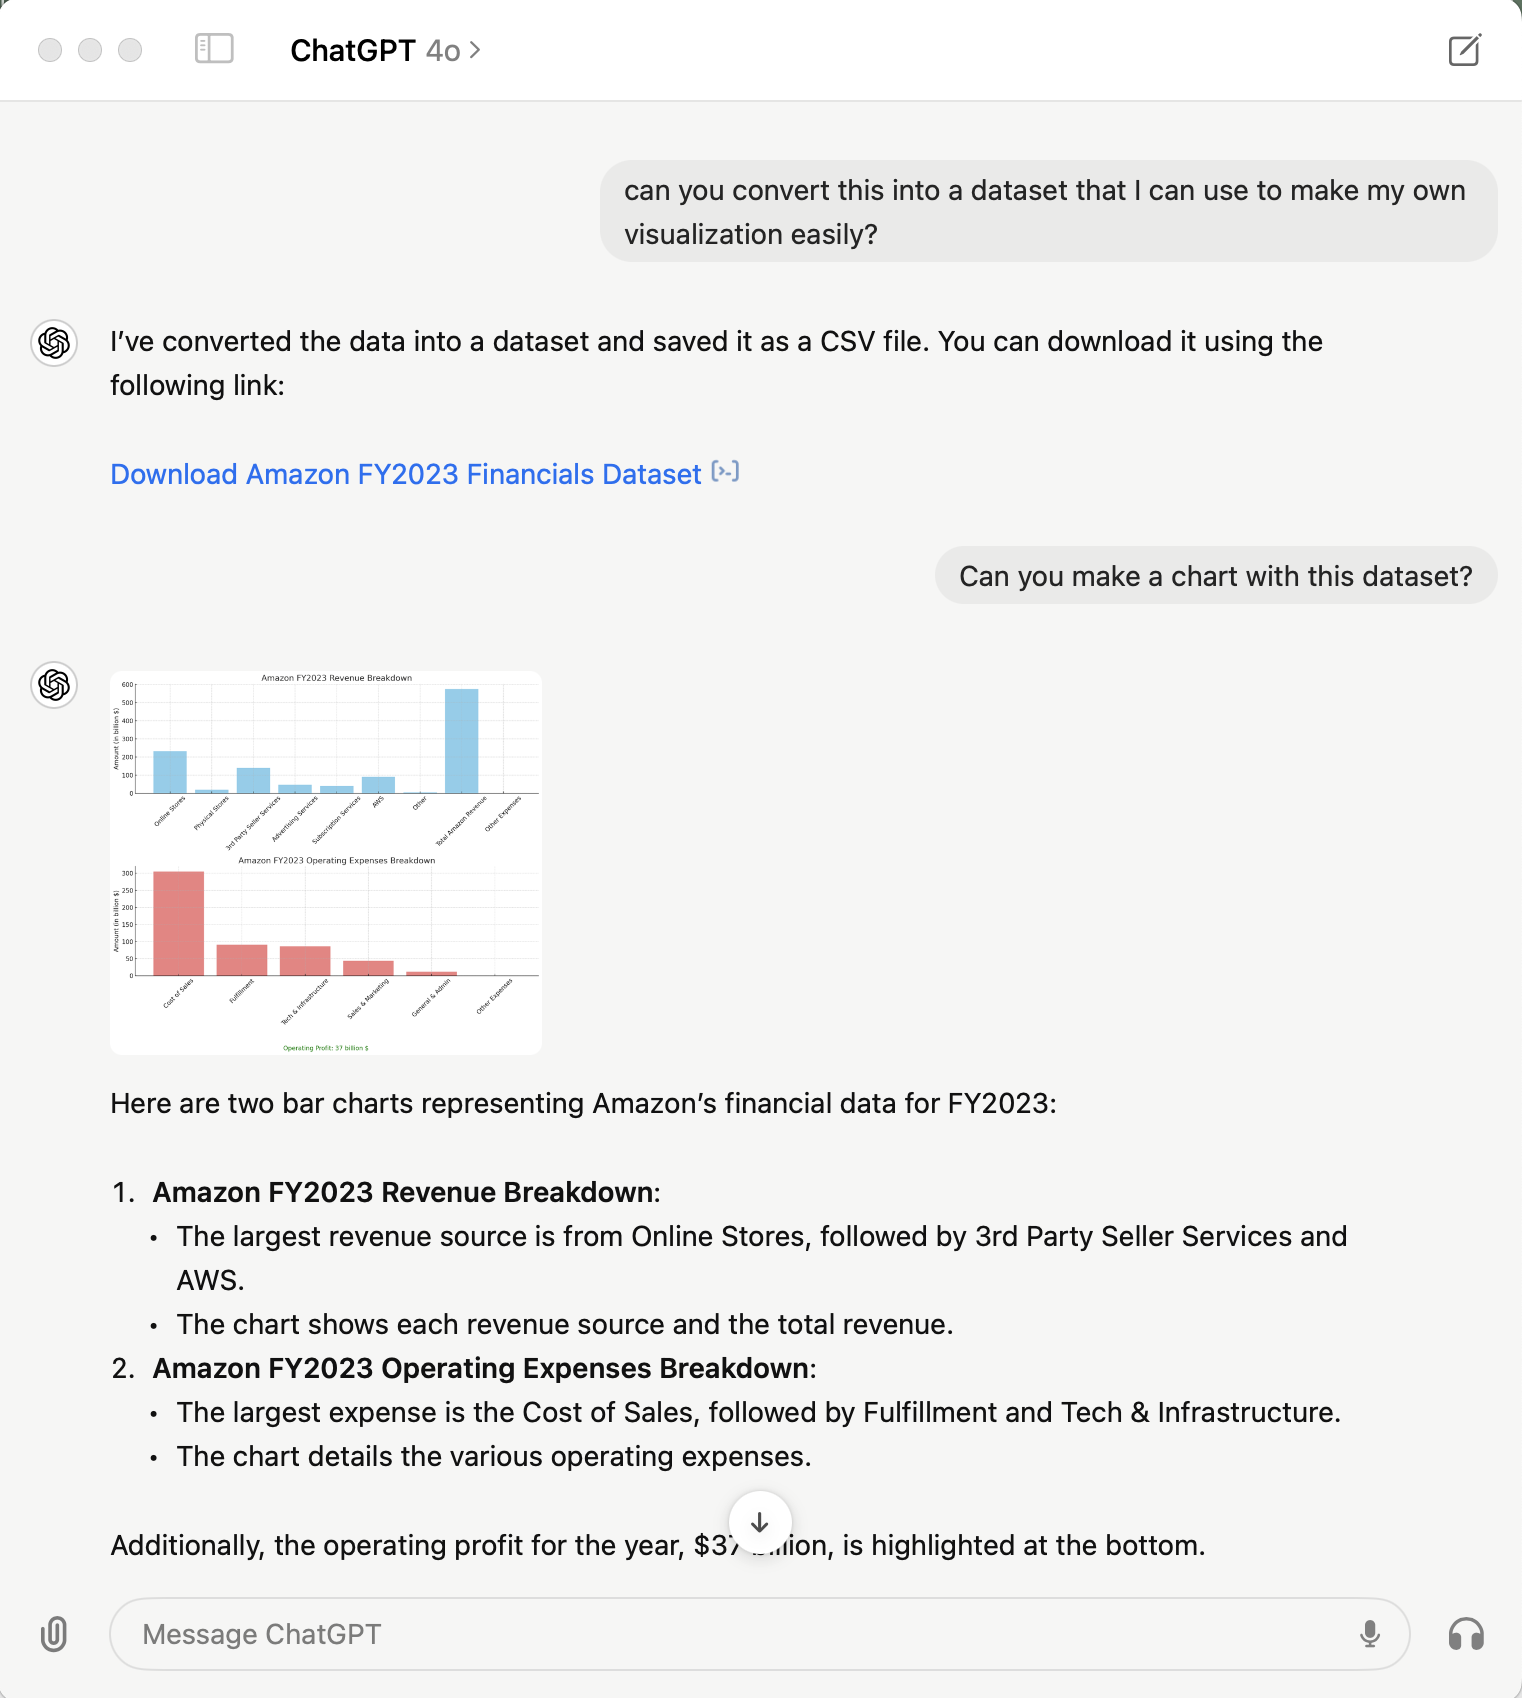
Taking it one step further, I challenged it to extract the data points as a downloadable dataset. It successfully saved the dataset as a CSV file with a download link! Notably, in the chart, there are two ‘Other’ categories, one under revenue and another under expenses. GPT automatically renamed one of them to ‘Other Expenses’ to avoid confusion – a detail I appreciated.
Analyze and Visualize Data
GPT has the amazing capability of data analysis as I have evaluated in this blog. It is even becoming stronger with recent updates, though I haven’t got access to features like real-time table and visualization edits yet.
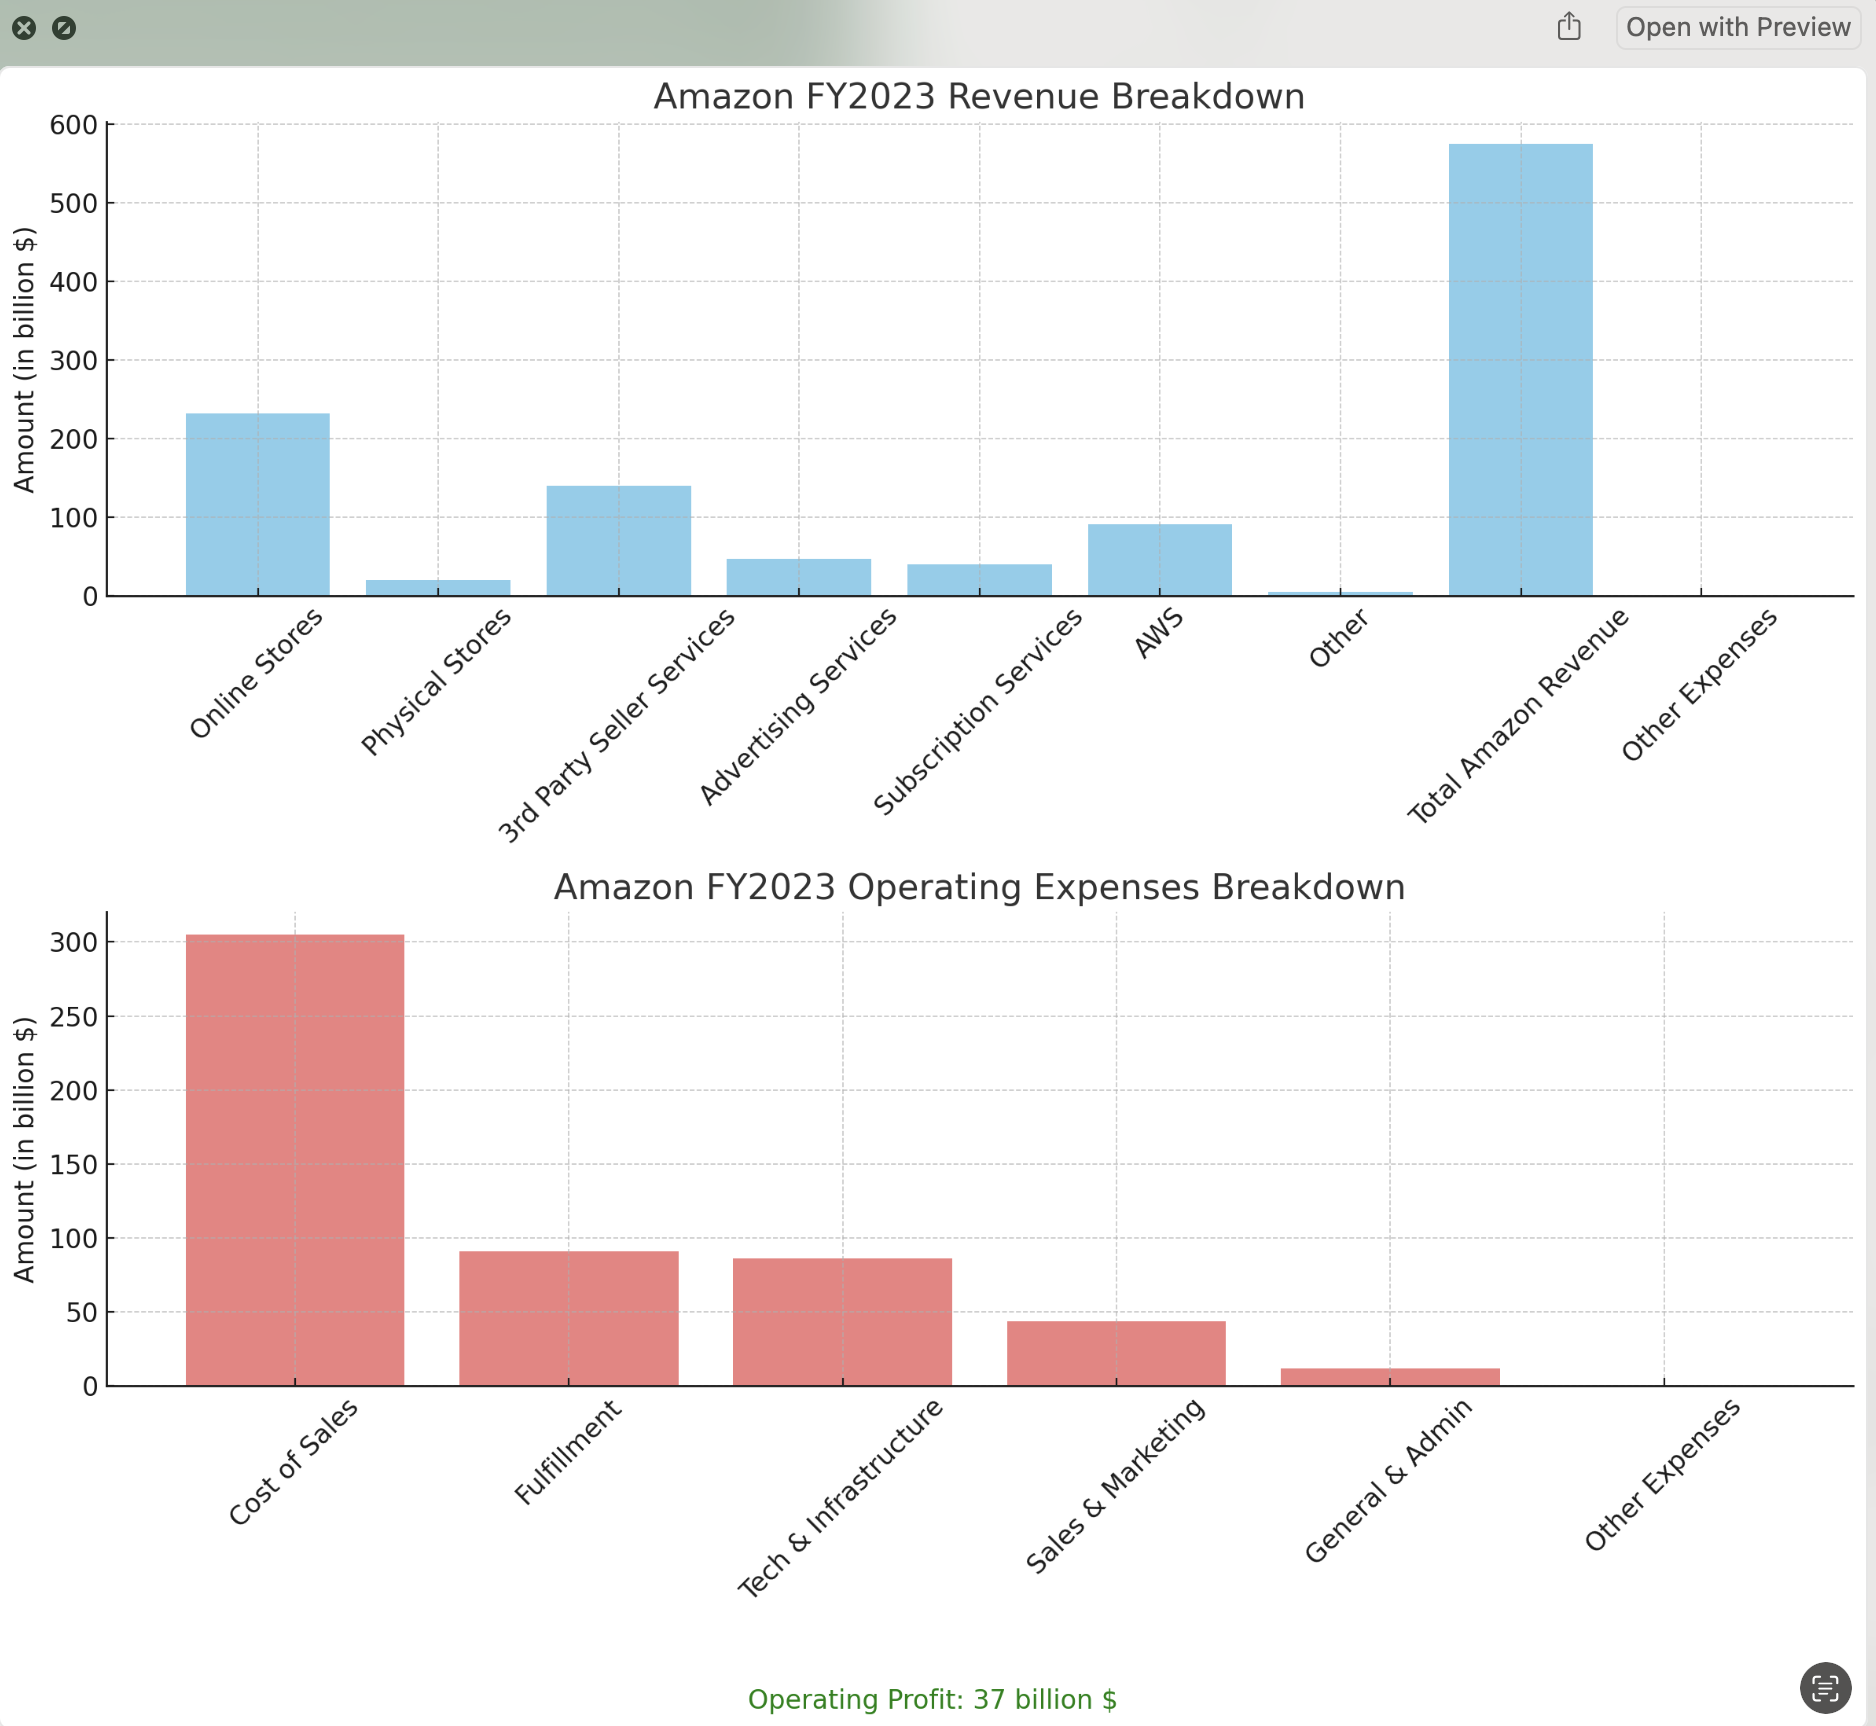
To continue testing the Desktop App, I asked it to make a visualization using the same dataset it had just prepared for me. It created a simple visualization with two bar charts and a text label of the operating profit at the bottom. This visualization is simple but effective in conveying the story.
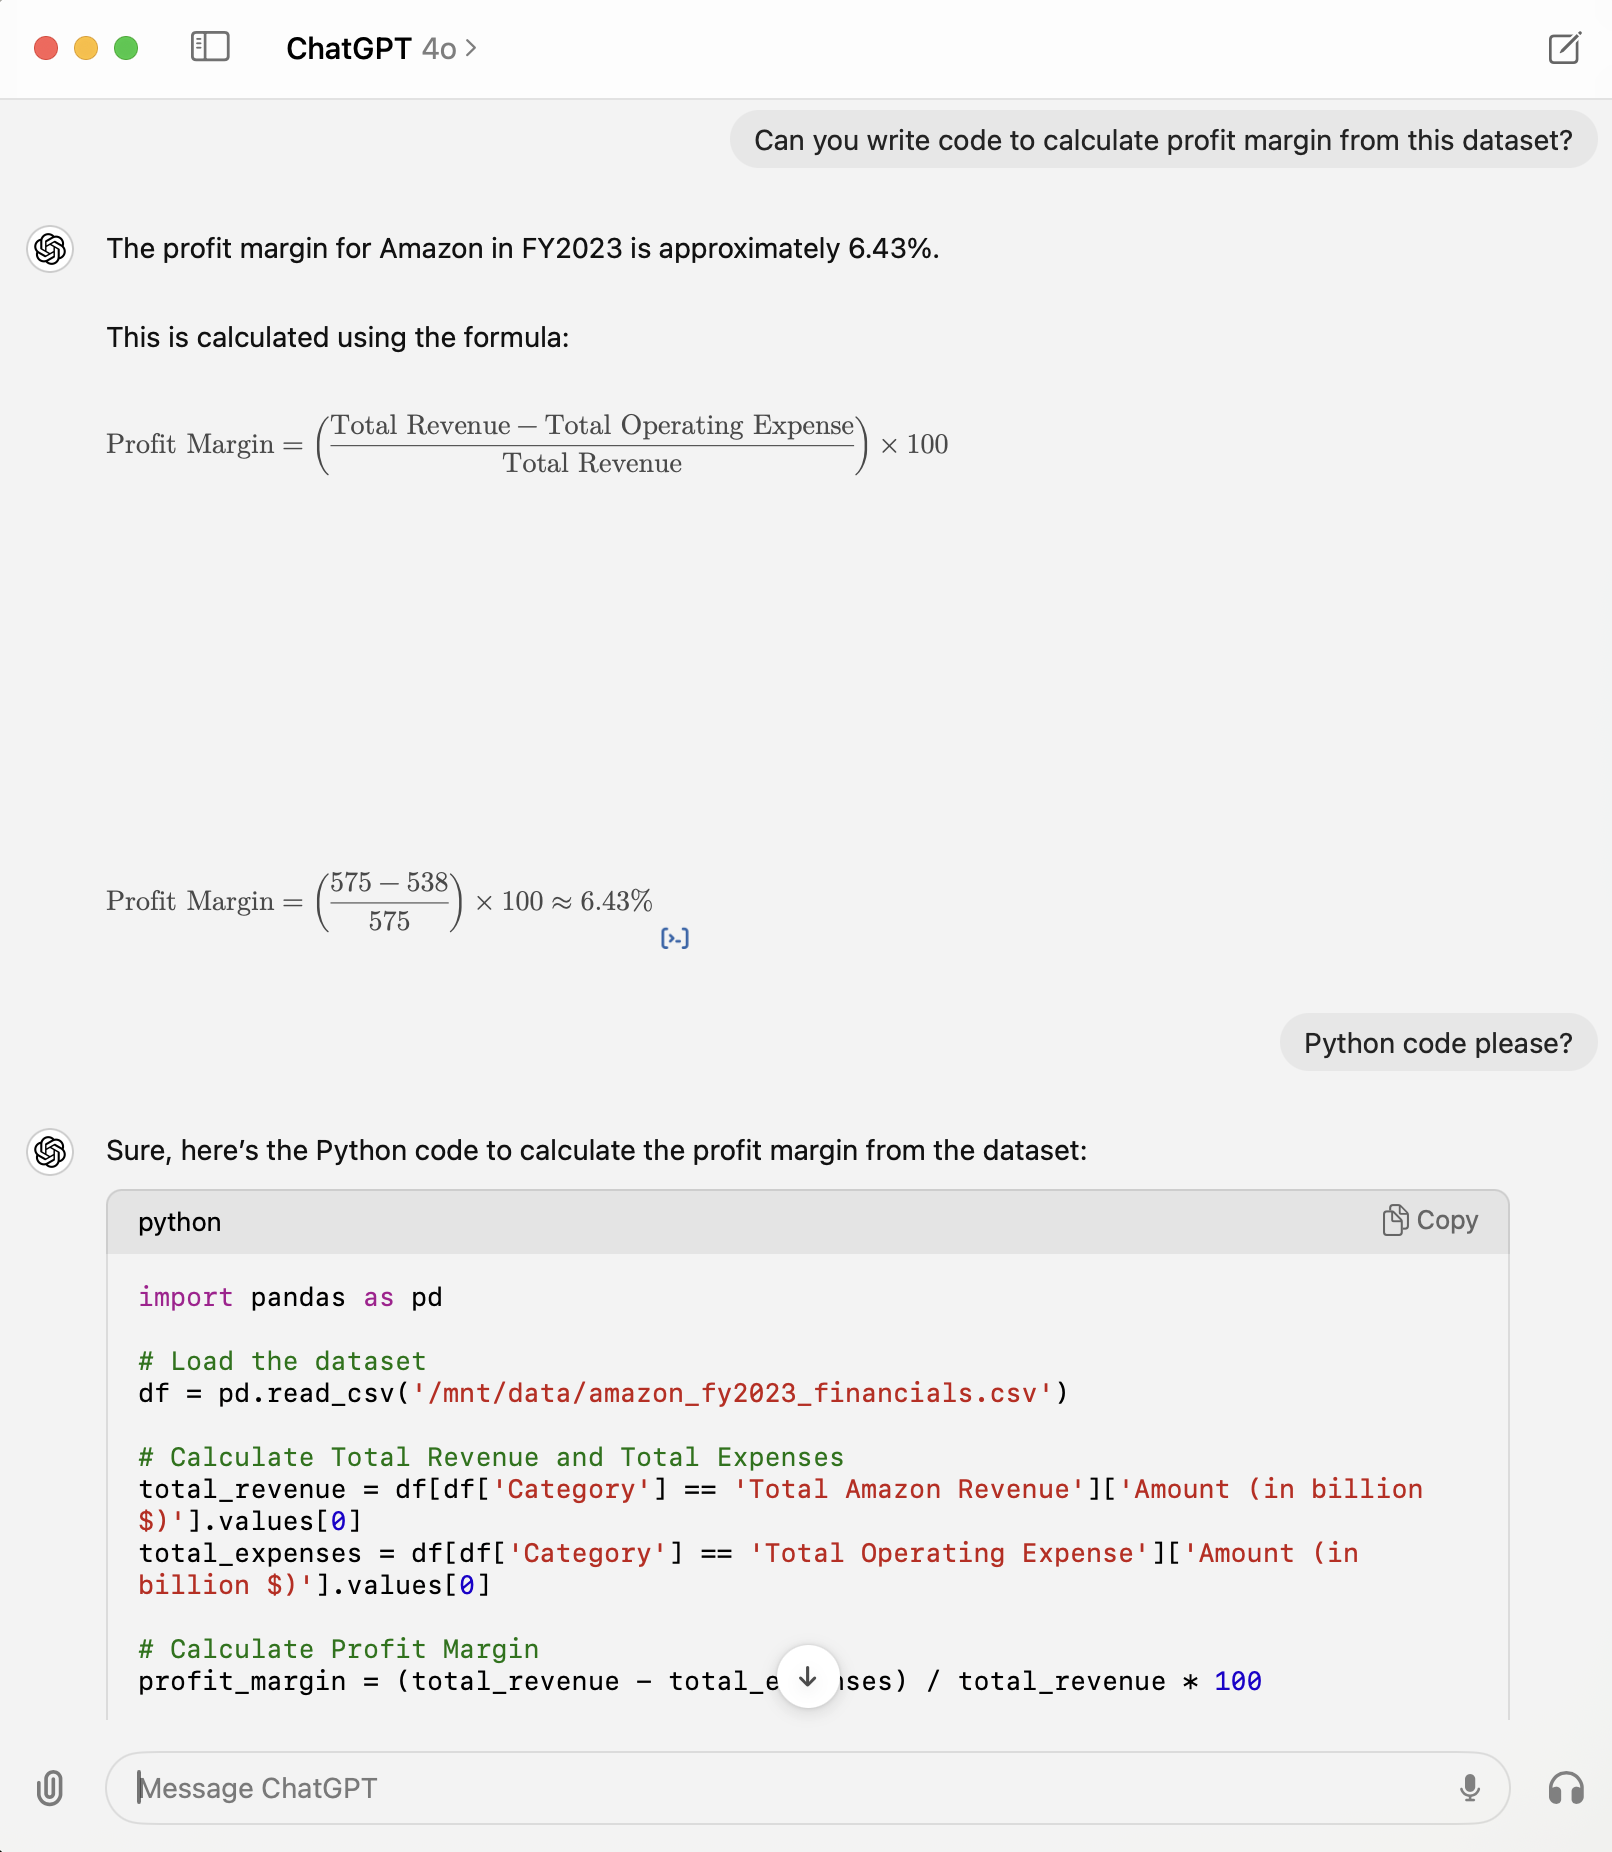
I then asked it to calculate the profit margin for me. It provided the correct answer with well-formatted formulas, explanations, and the underlying Python code.
Real-time Data Tool Assistance
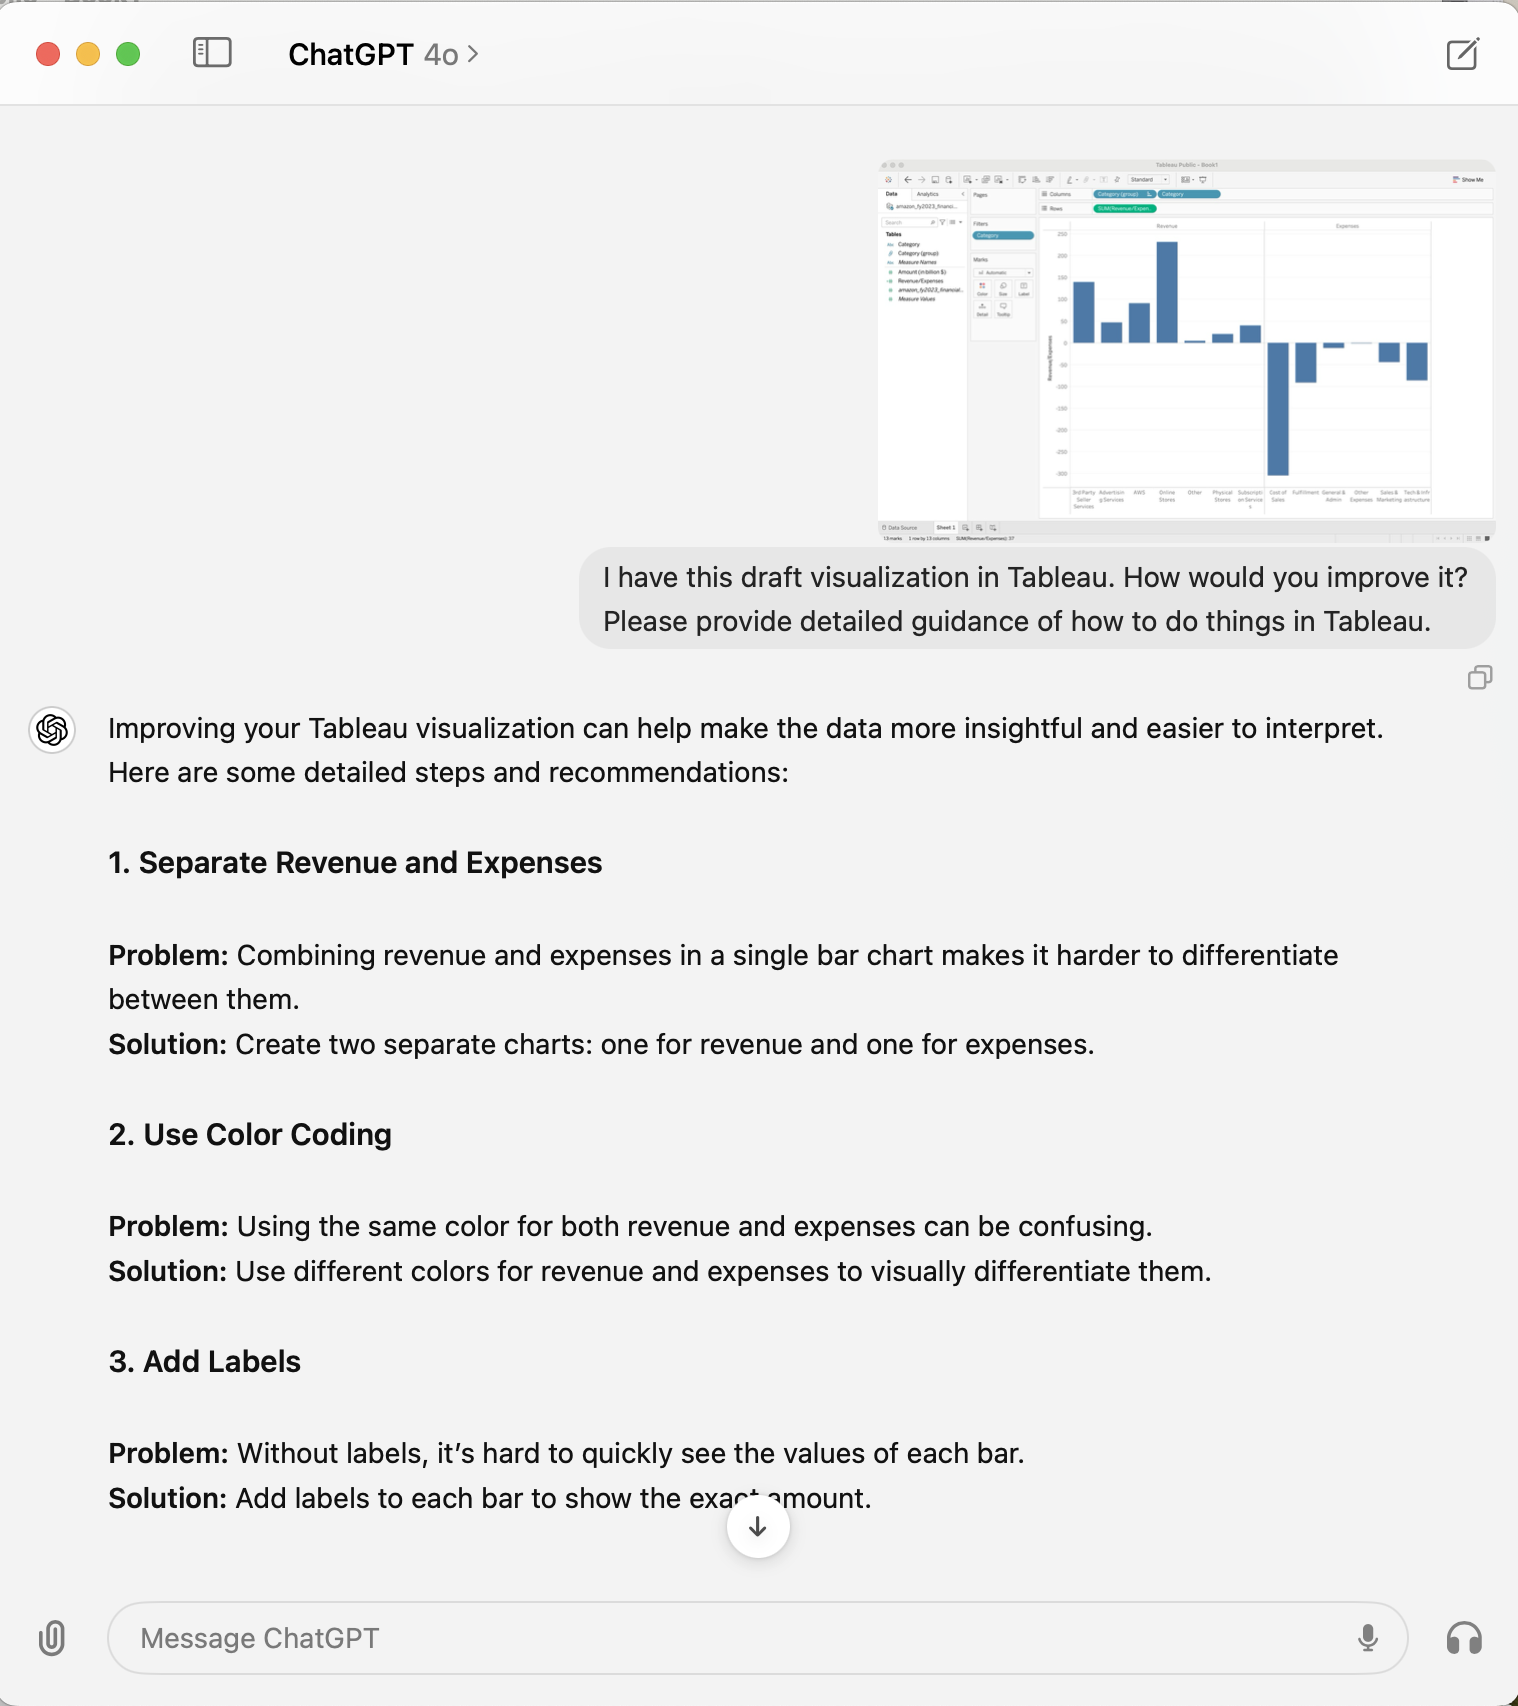
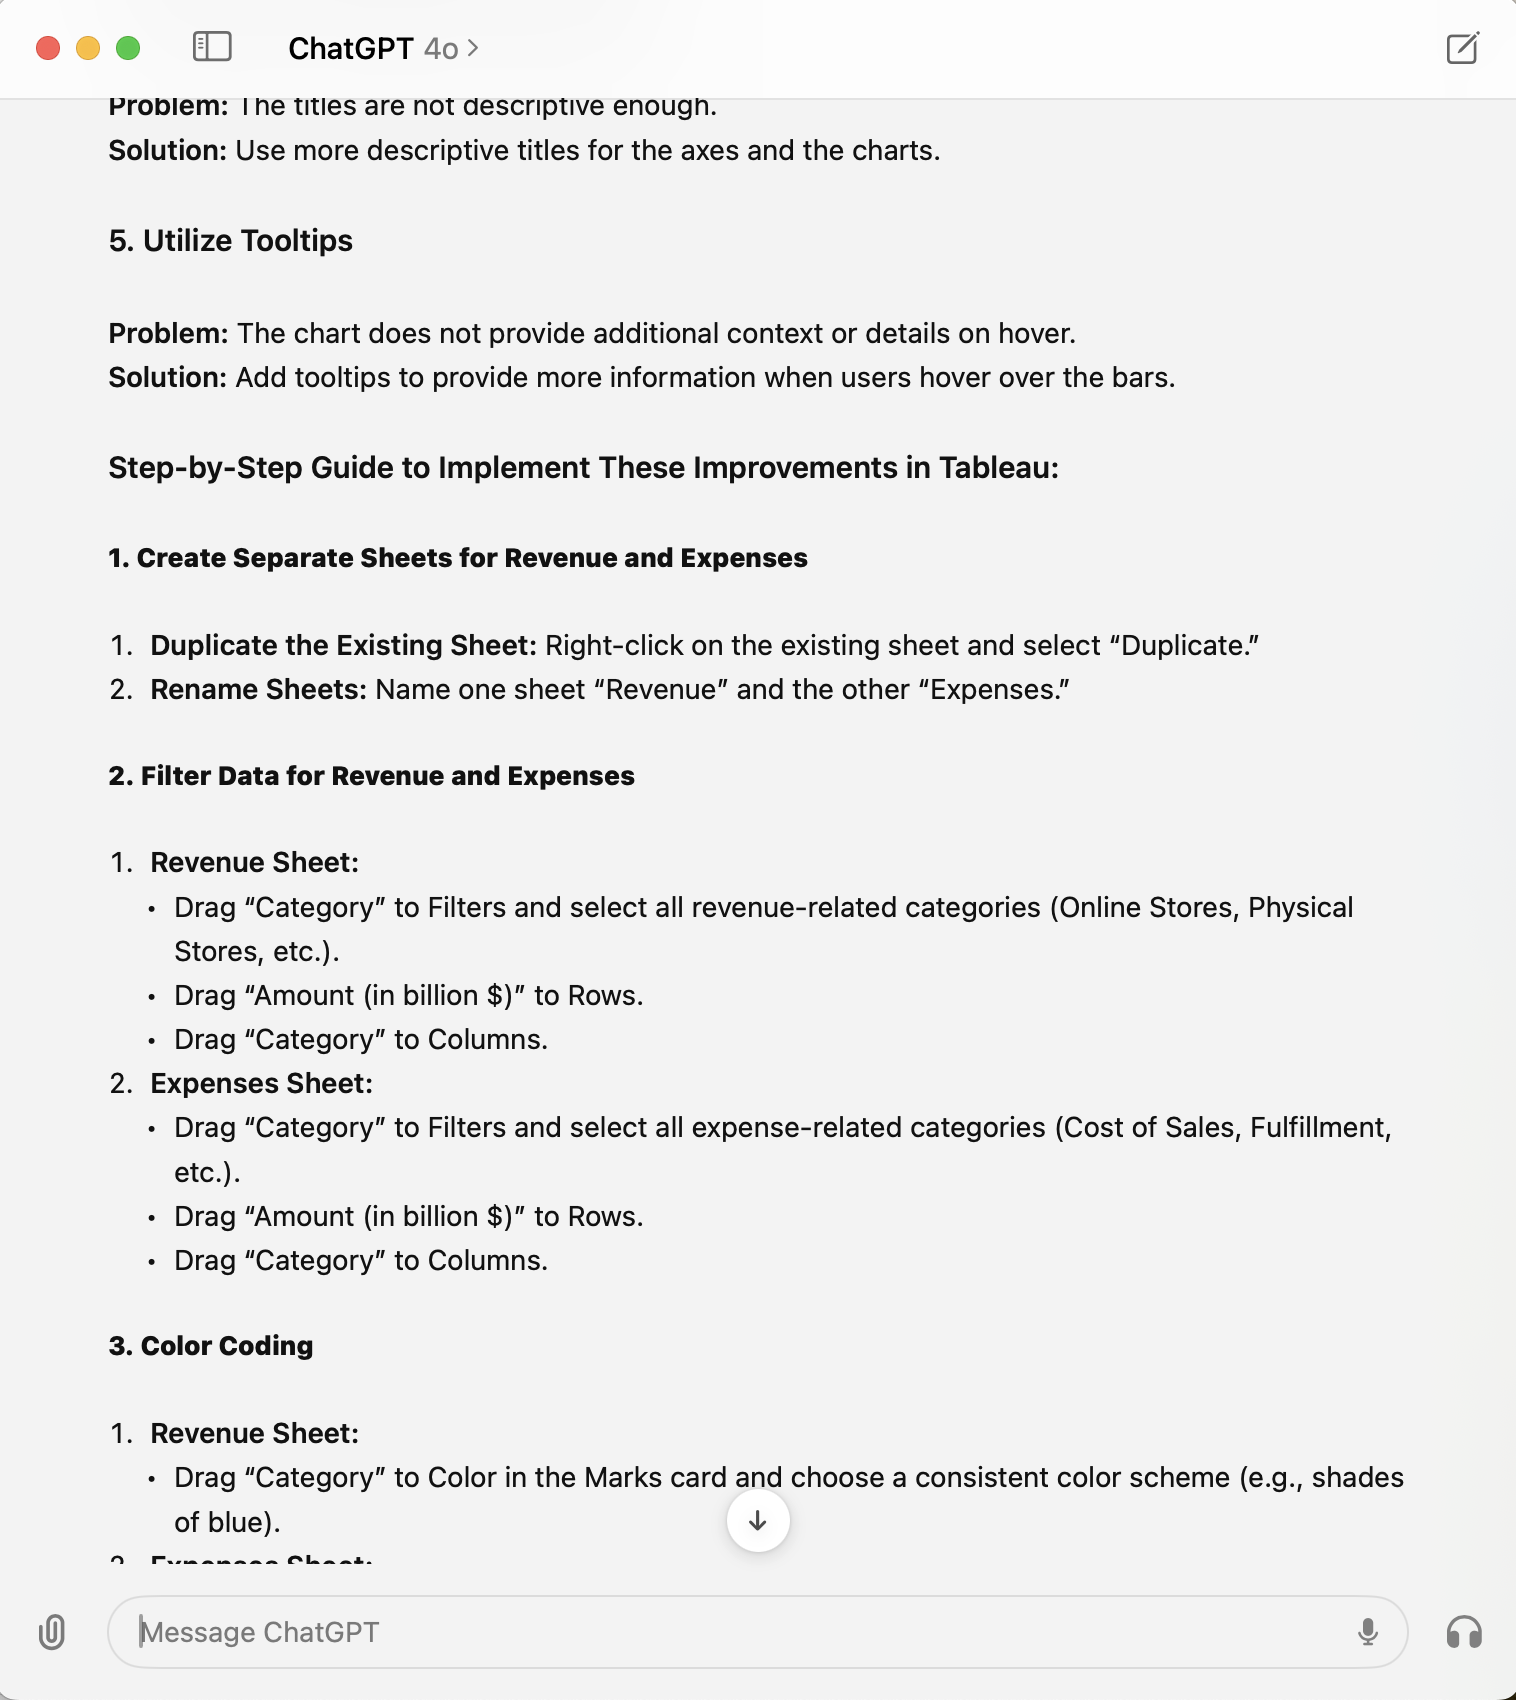
The last thing I tested was how it could assist me using various data tools. I used Tableau to make a rough visualization using the same dataset, pretending I didn’t know much about Tableau. I then took a screenshot and asked GPT how to improve it.
It provided high-level recommendations as well as step-by-step guidance. These were accurate and easy to follow. The adjusted visualization turned out to be quite similar to the one GPT made earlier, not very advanced but straightforward with this simple dataset. I am excited to utilize this capability further for my weekly visualization project.
Final Thoughts
In the sections above, I demonstrated how the GPT Desktop App can be seamlessly integrated into day-to-day analytics workflows. The example is simple but highlights the potential for various use cases. Here are some ideas that came to mind:
- Summarize the articles you are reading and answer questions on the topic;
- Ask coding questions and get real-time debugging help;
- Reply to incoming emails;
- Voice chat with GPT to brainstorm the analysis you are working on, etc.
There are existing plugins for these use cases, but the GPT Desktop App simplifies them and allows you to interact with everything in one place. I plan to explore more, and I’d love to hear any ideas you have!

