
ChatGPT vs. Claude vs. Gemini for Data Analysis (Part 2): Who’s the Best at EDA?
Five criteria to compare ChatGPT, Claude, and Gemini in tackling Exploratory Data Analysis
Context
Welcome back to the second installment of my series, ChatGPT vs. Claude vs. Gemini for Data Analysis! In this series, I aim to compare these AI tools across various data science and analytics tasks to help fellow data enthusiasts and professionals choose the best AI assistant for their needs. If you missed the first article, I compared their performance in writing and optimizing SQL queries - be sure to check it out!
Although the 2024 Olympics have concluded, our AI competition is just heating up. So far, Claude 3.5 Sonnet has taken the lead! But can it maintain its position, or will ChatGPT and Gemini catch up? 🏆
In this second article, we’ll focus on their ability to independently conduct Exploratory Data Analysis (EDA). As a data scientist, imagine the convenience of having an AI tool that can instantly provide data insights and recommendations for a new dataset to inform advanced analysis and modeling. Let’s see which model delivers the best EDA.
What is EDA
Exploratory Data Analysis (EDA) is the process of examining and analyzing datasets to understand their main characteristics, often using visual techniques. It involves data cleaning, summarizing statistics, and identifying patterns, trends, and relationships within the data. The goal is to uncover insights that guide further analysis or modeling, ensuring a thorough understanding of the data before advancing to more complex tasks. Key components of EDA include:
- Data inspection: Understanding the dataset’s structure (e.g., number of rows, columns, data types) and previewing the sample data.
- Data cleaning: Correcting data types, handling missing values, and validating data (e.g., ensuring values are unique where necessary).
- Univariate analysis: Performing descriptive statistics (e.g., mean, median, quantiles) on a single column with visualizations.
- Bivariate and multivariate analysis: Exploring relationships between pairs and multiple sets of variables.
- Insights and recommendations: Generating insights and actionable recommendations to inform further analysis or modeling.
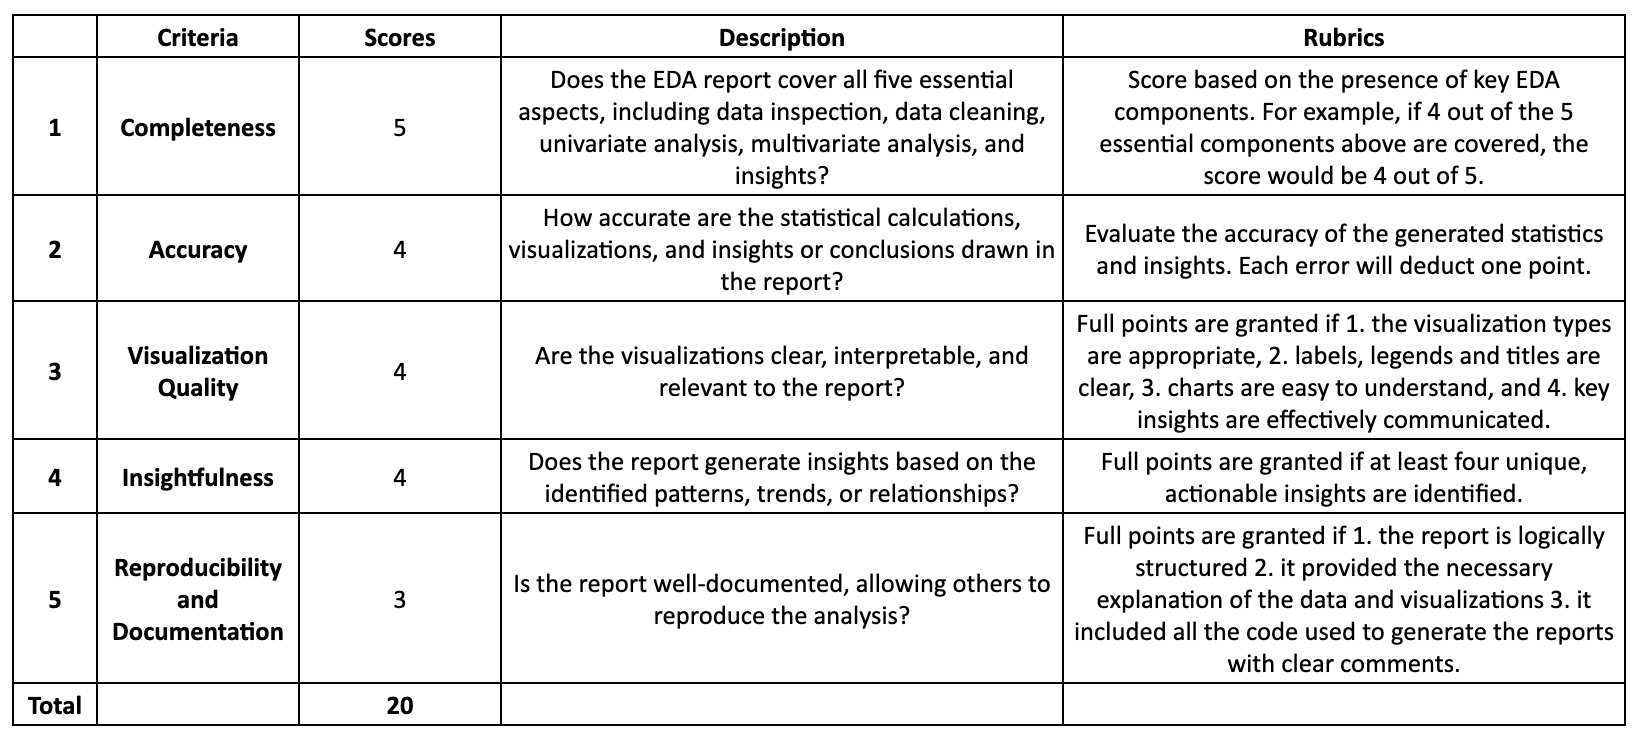
Evaluation Criteria
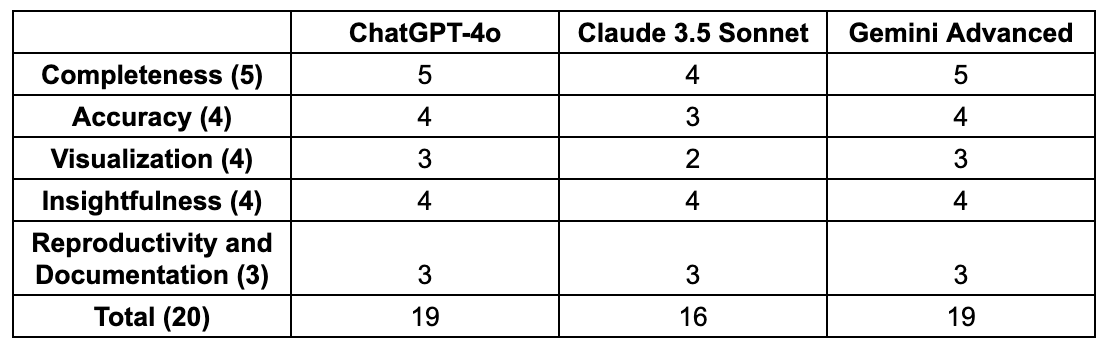
We’ll evaluate the three tools in ‘self-driving’ mode, providing only one prompt to conduct EDA and seeing how far they can go. The evaluation will be based on five key aspects:
- Completeness (5 points): Does the EDA report cover all five essential aspects, including data inspection, data cleaning, univariate analysis, multivariate analysis, and insights?
- Accuracy (4 points): How accurate are the statistical calculations, visualizations, and insights or conclusions drawn in the report?
- Visualization Quality (4 points): Are the visualizations clear, interpretable, and relevant to the report?
- Insightfulness (4 points): Does the report generate insights based on the identified patterns, trends, or relationships?
- Reproducibility and Documentation (3 points): Is the report well-documented, allowing others to reproduce the analysis?
Please find the detailed rubrics in the table below:
Problem Setup
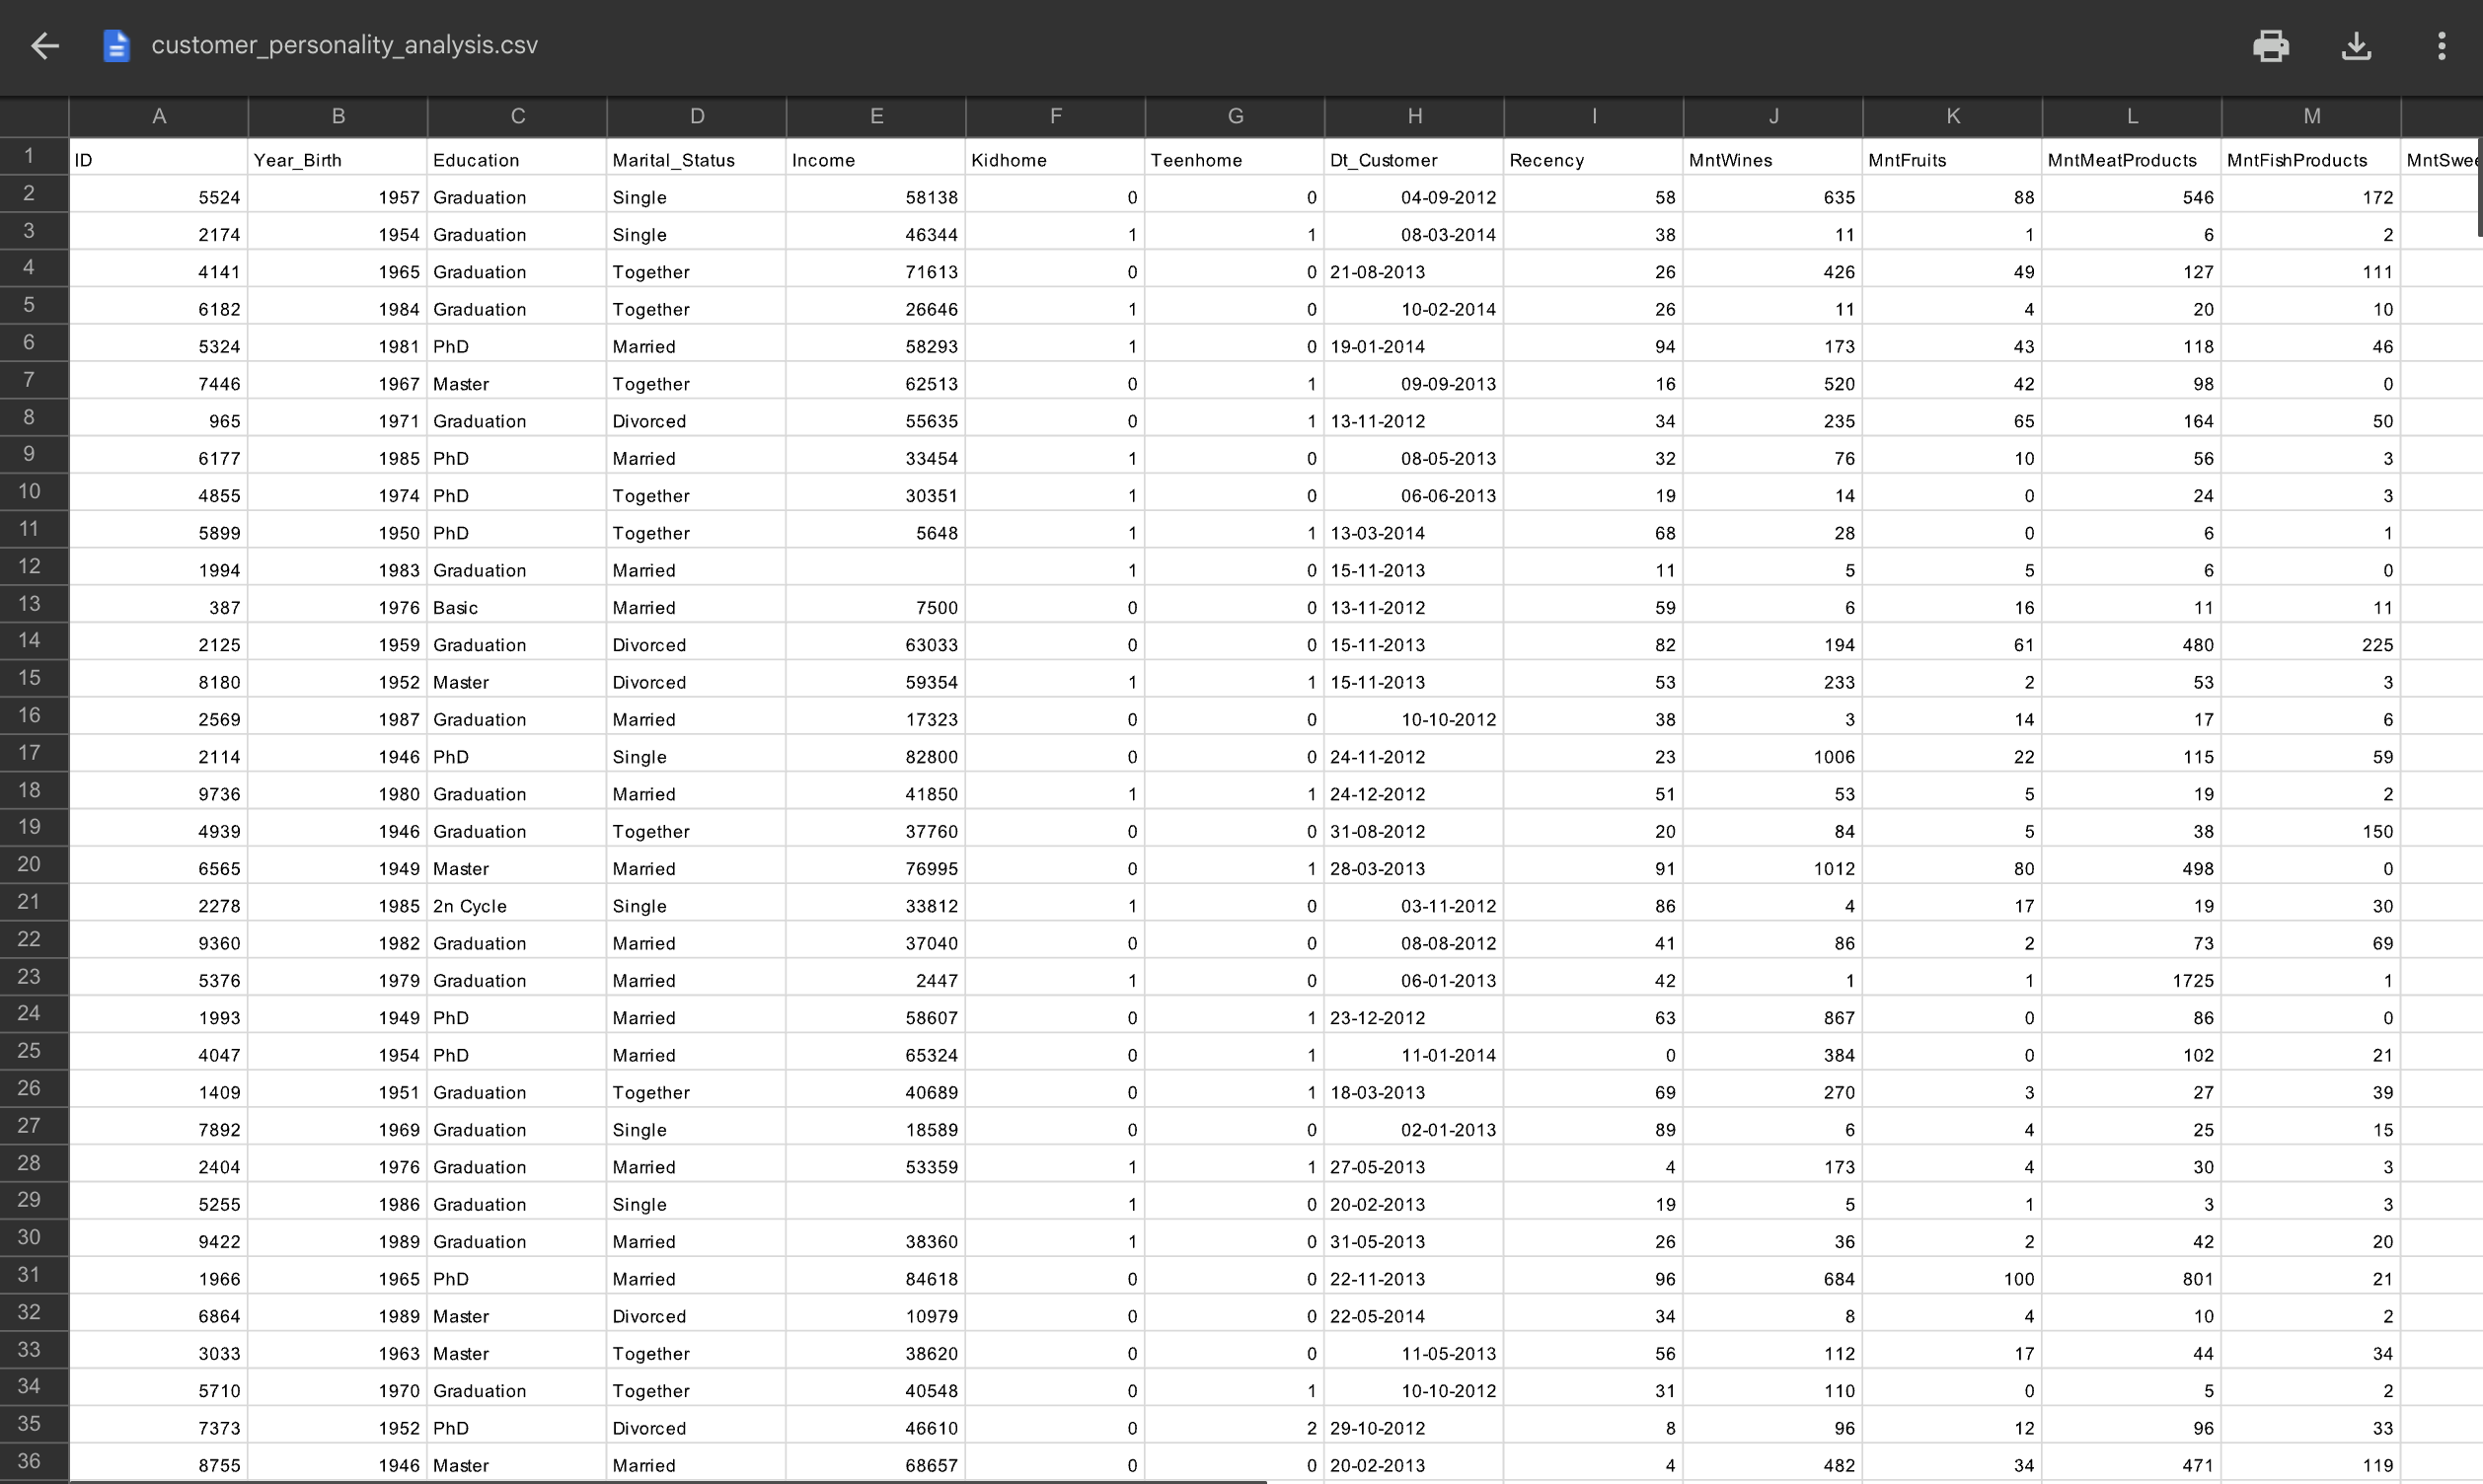
Here’s the dataset we used for this evaluation: the Customer Personality Analysis dataset from Kaggle (CC0: Public Domain license).
And here is my prompt:
You are a data scientist at a grocery chain.
You have a dataset with your customers' demographic info,
purchase data, and marketing campaign history.
Your objective today is to conduct a thorough exploratory data analysis (EDA)
of this dataset with necessary data cleaning, analysis and visualizations,
clear insights, and actionable recommendations.
Your EDA will be used to better understand the customers,
influence product strategies based on customer behaviors,
and inform further customer segment analysis and modeling.

Here are the column descriptions:
1. People
-ID: Customer's unique identifier
-Year_Birth: Customer's birth year
-Education: Customer's education level
-Marital_Status: Customer's marital status
-Income: Customer's yearly household income
-Kidhome: Number of children in customer's household
-Teenhome: Number of teenagers in customer's household
-Dt_Customer: Date of customer's enrollment with the company
-Recency: Number of days since customer's last purchase
-Complain: 1 if the customer complained in the last 2 years, 0 otherwise
2. Products
-MntWines: Amount spent on wine in last 2 years
-MntFruits: Amount spent on fruits in last 2 years
-MntMeatProducts: Amount spent on meat in last 2 years
-MntFishProducts: Amount spent on fish in last 2 years
-MntSweetProducts: Amount spent on sweets in last 2 years
-MntGoldProds: Amount spent on gold in last 2 years
3. Promotion
-NumDealsPurchases: Number of purchases made with a discount
-AcceptedCmp1: 1 if customer accepted the offer in the 1st campaign, 0 otherwise
-AcceptedCmp2: 1 if customer accepted the offer in the 2nd campaign, 0 otherwise
-AcceptedCmp3: 1 if customer accepted the offer in the 3rd campaign, 0 otherwise
-AcceptedCmp4: 1 if customer accepted the offer in the 4th campaign, 0 otherwise
-AcceptedCmp5: 1 if customer accepted the offer in the 5th campaign, 0 otherwise
-Response: 1 if customer accepted the offer in the last campaign, 0 otherwise
4. Place
-NumWebPurchases: Number of purchases made through the company's website
-NumCatalogPurchases: Number of purchases made using a catalogue
-NumStorePurchases: Number of purchases made directly in stores
-NumWebVisitsMonth: Number of visits to company's website in the last month
ChatGPT-4o
Total score: 19/20
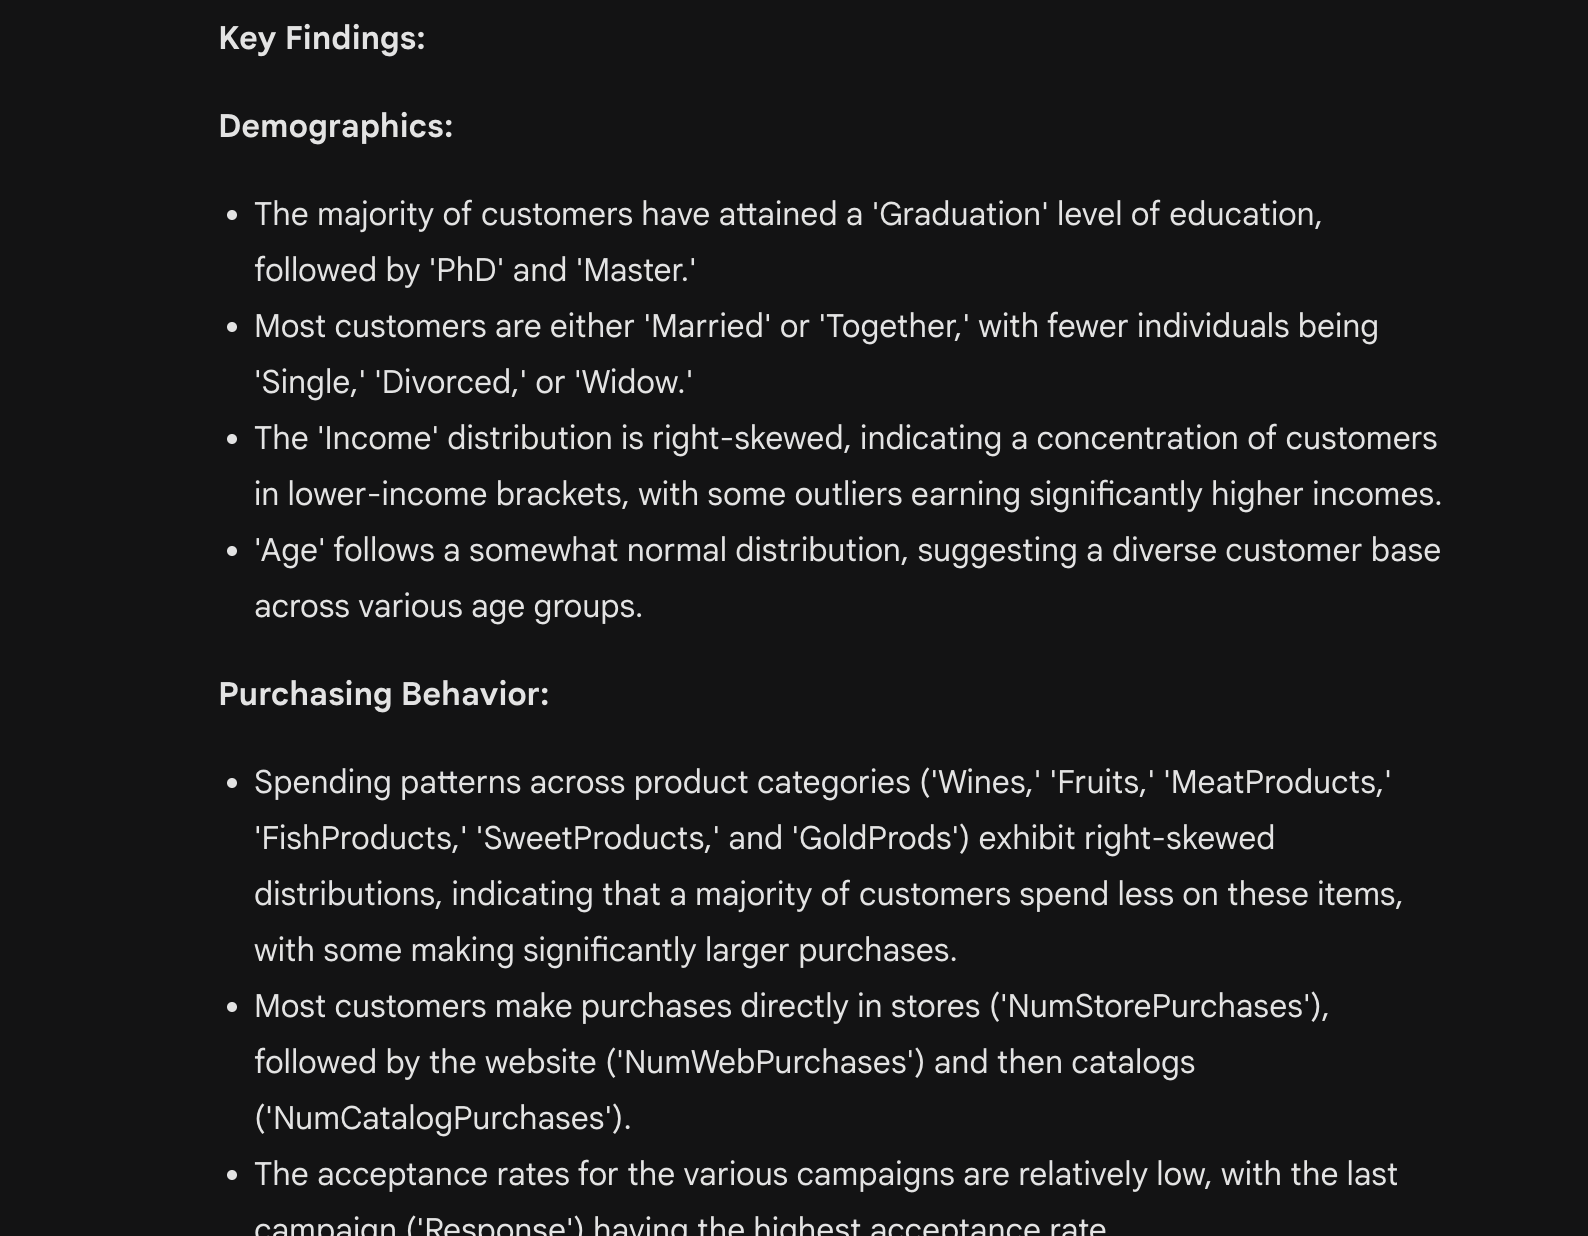
1. Completeness (5/5)
ChatGPT’s EDA response begins with a summary of the steps it would take, covering all five critical components of EDA.
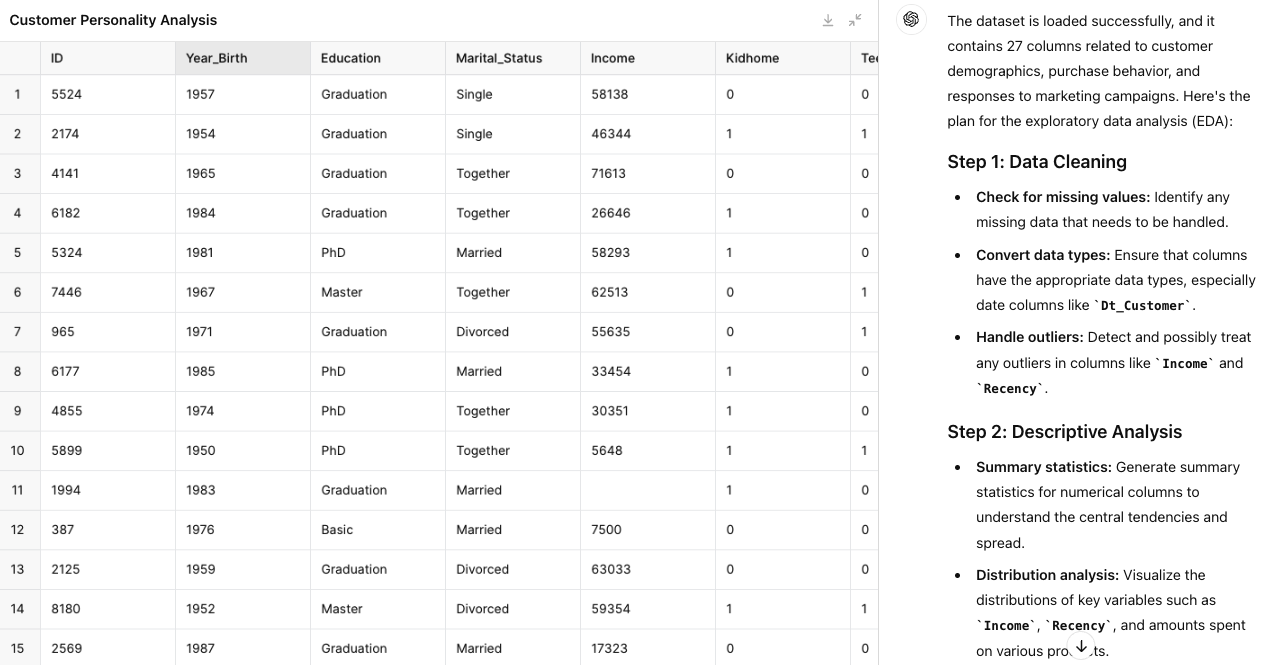
Data inspection: One advantage of doing data analysis with ChatGPT is that it allows easy dataset preview by expanding the dataset directly in the interface.
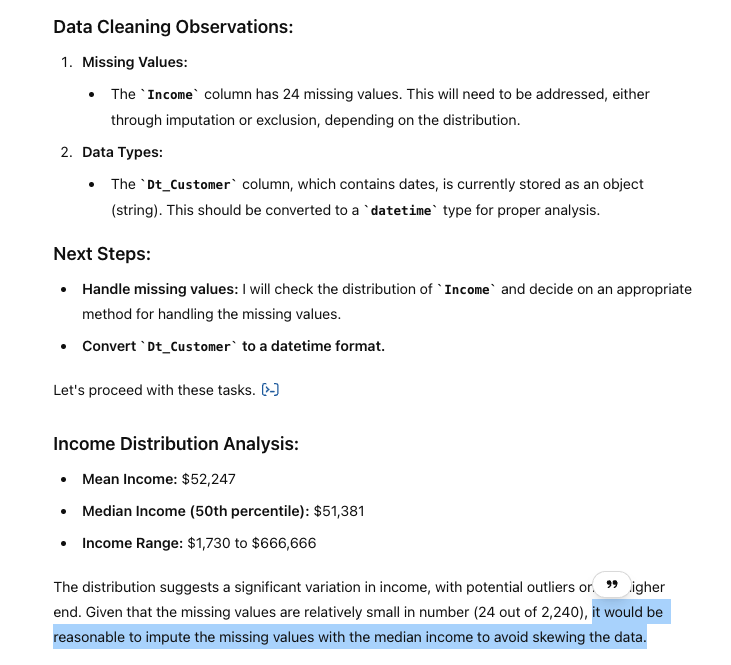
Data cleaning: ChatGPT performed the necessary steps, including filling in missing values and correcting data types. For missing values, it carefully evaluated the distribution of income and decided to impute them with the median income, offering sound reasoning.
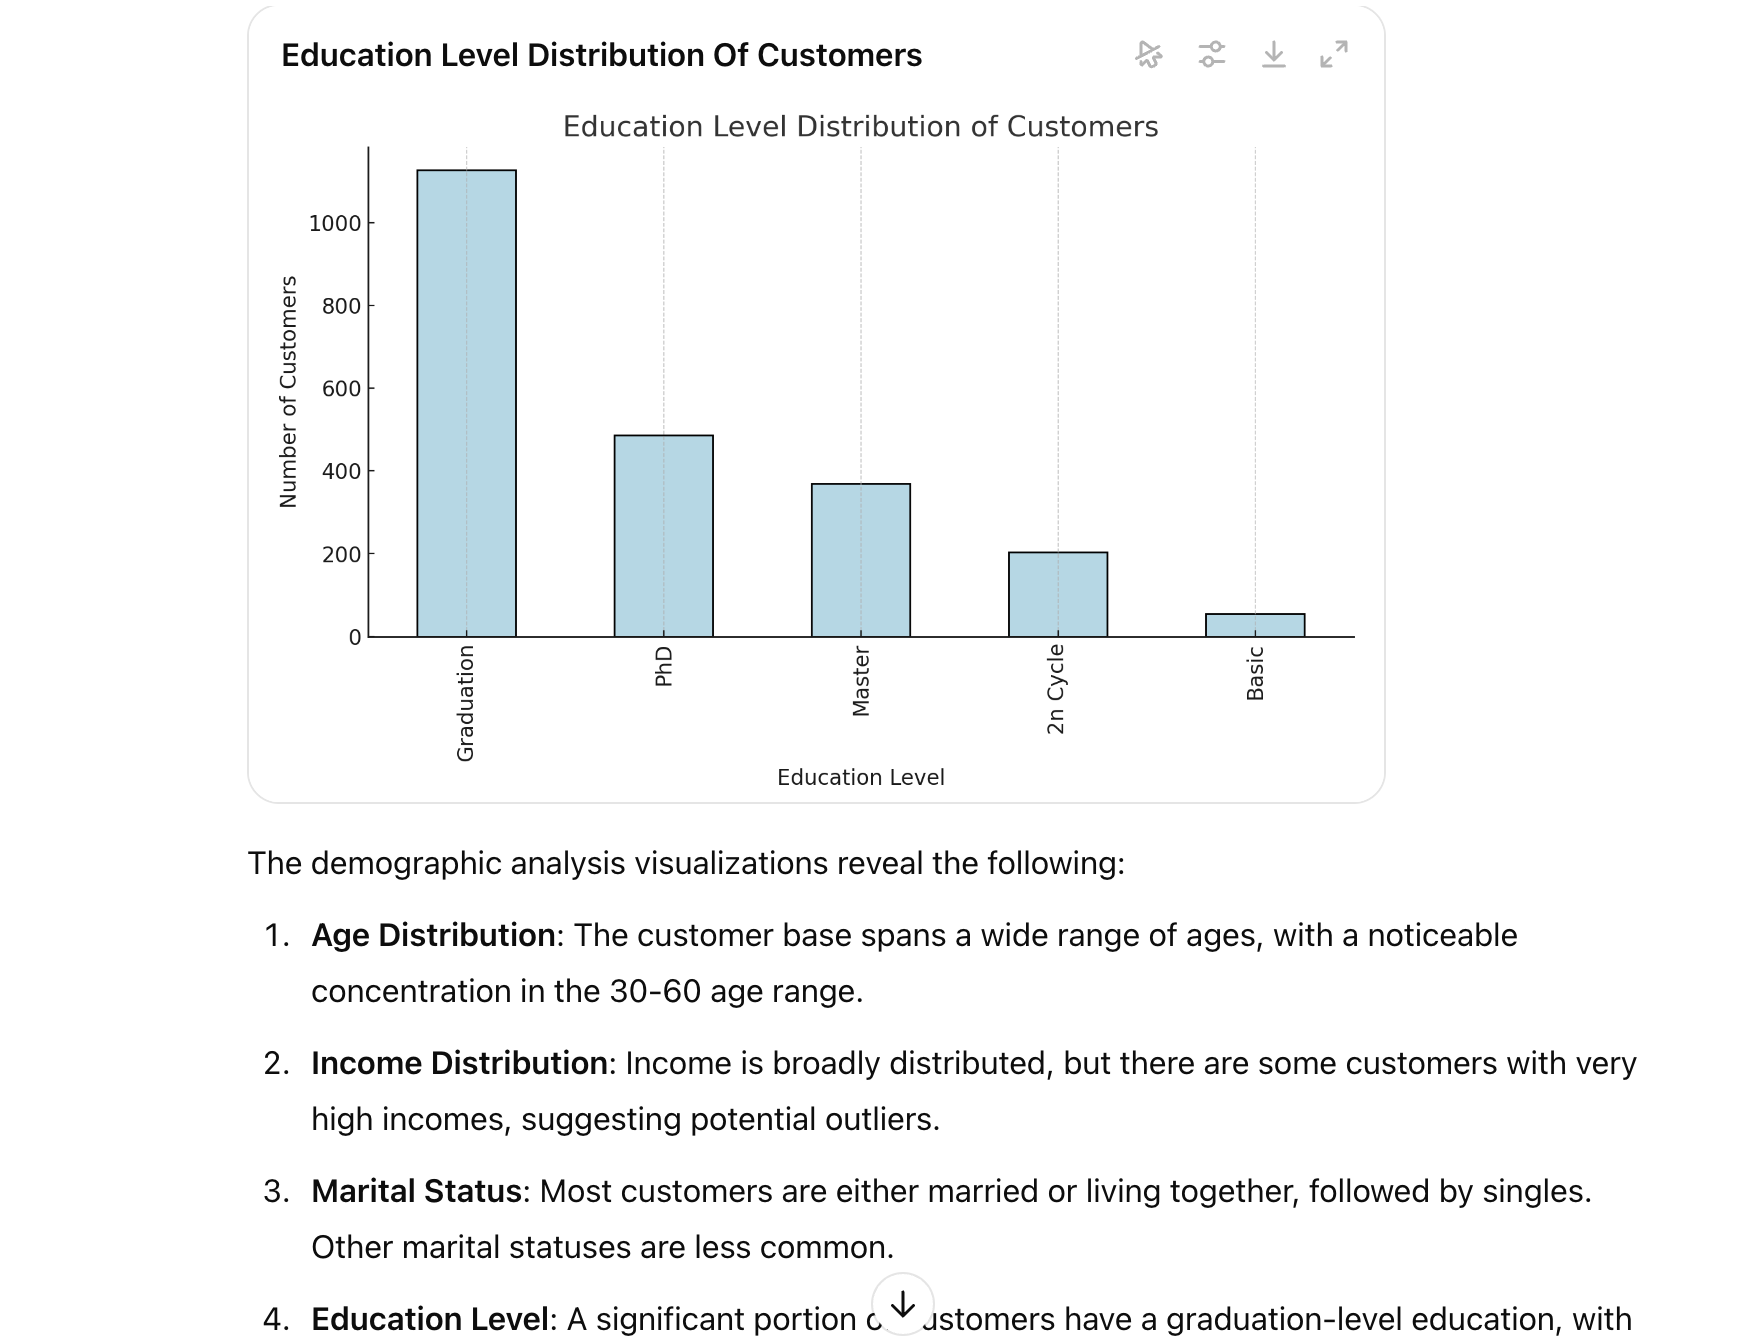
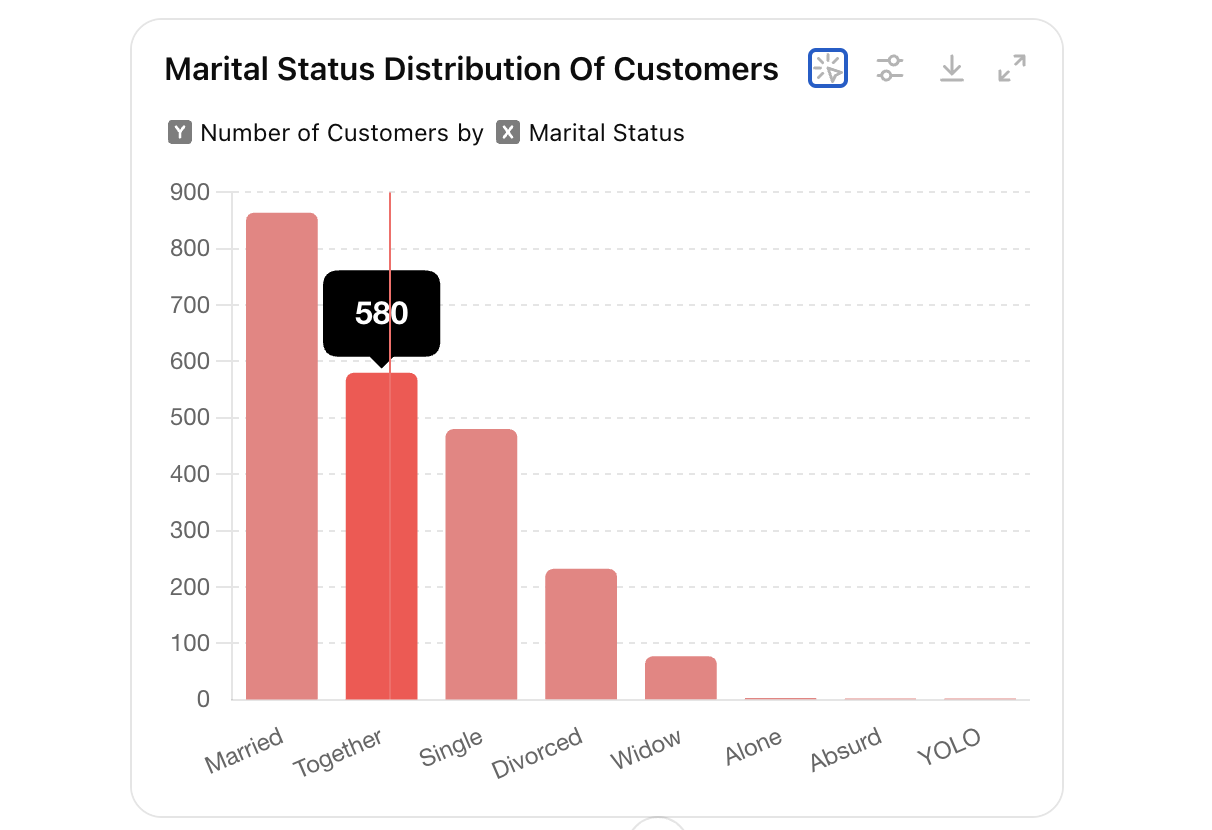
Univariate analysis: ChatGPT analyzed distributions for key features including age, income, marital status, and education, and provided summaries of the findings.
Bivariate and multivariate analysis: ChatGPT explored the relationship between pairs of features, such as the correlation between income and total spending, and average spending by product categories. It again generated key insights from these analyses.
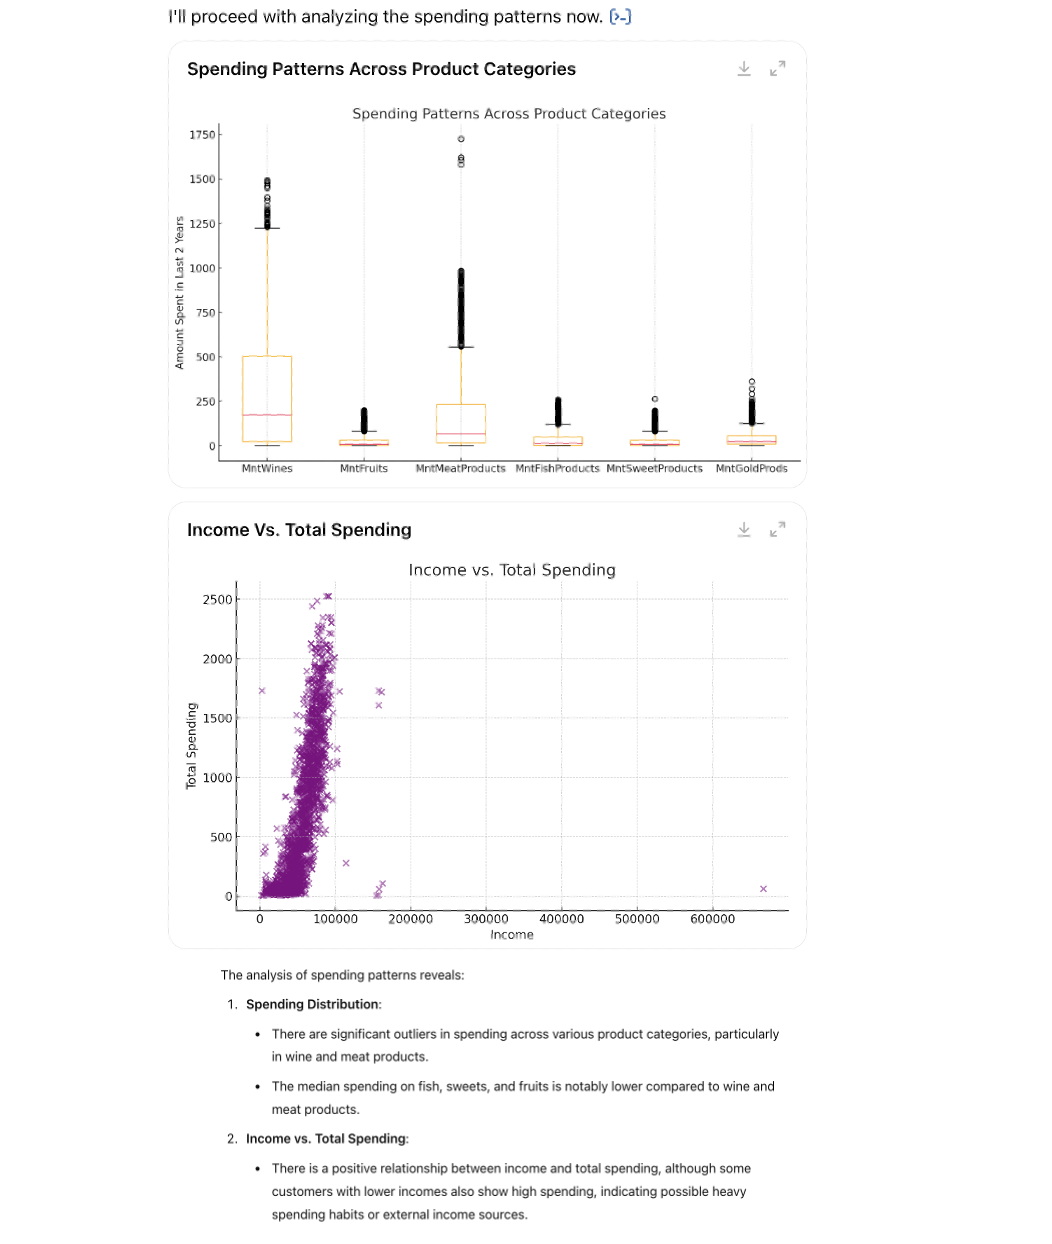
Insights and recommendations: ChatGPT provided key insights following each visualization sections, and concluded with clear and actionable recommendations accordingly.
ChatGPT - Insights (image by author)
2. Accuracy (4/4)
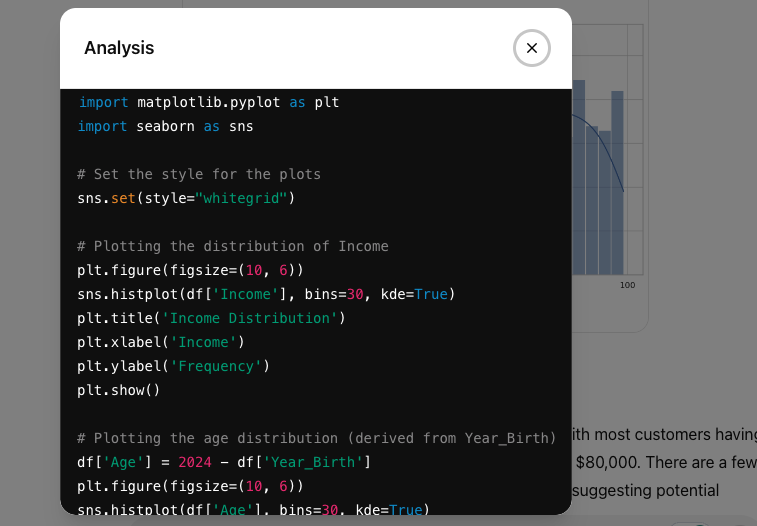
All the data cleaning, visualization, and analysis steps were backed by Python code. After manually running the code and comparing its results with those from Claude and Gemini, ChatGPT’s outputs were accurate. Its insights also aligned well with the analysis.
3. Visualization (3/4)
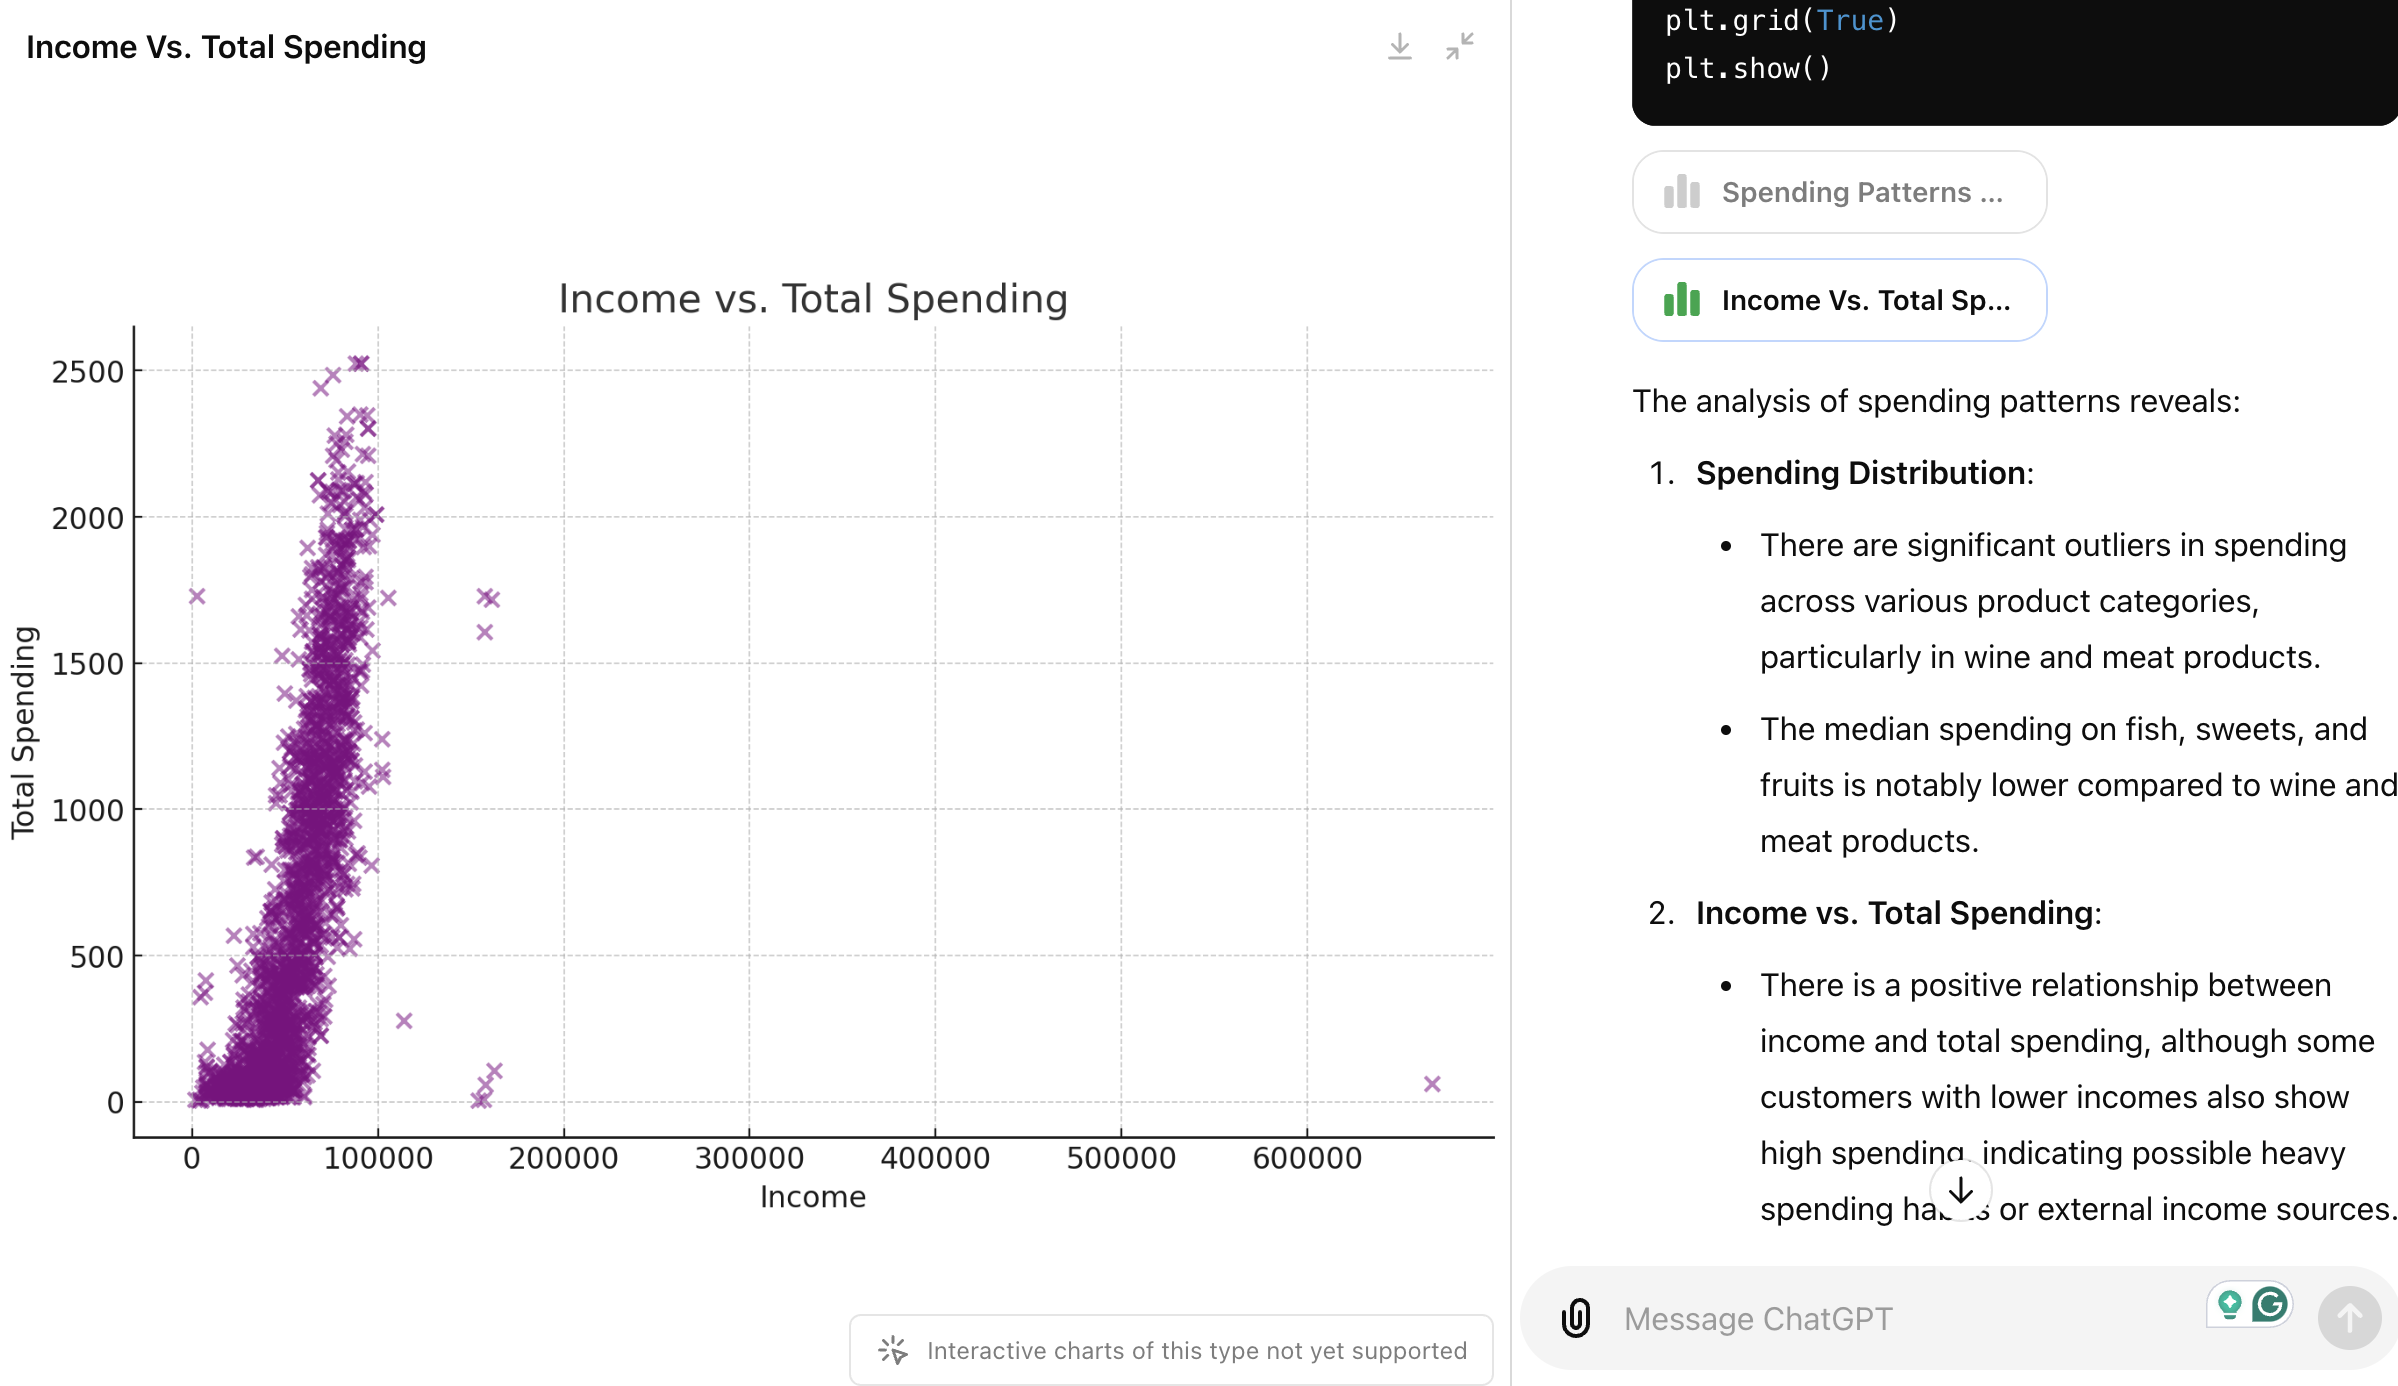
The visualizations created by ChatGPT were well-labeled with appropriate chart types and were accompanied by insights. You can also easily download the charts for documentation and presentations.
My only complaint is that while some simple visualizations were interactive (allowing you to hover over them to see the values), most were not. You can find my detailed evaluation of this feature in my previous article. Therefore, I deducted one point for potential improvement :)
4. Insightfullness (4/4)
As shown in the screenshots above, ChatGPT provided more than four insights with concrete and actionable recommendations, earning full points here.
5. Reproducibility and Documentation (3/3)
ChatGPT structured its report intuitively, with each section followed by code snippets to ensure reproducibility. Therefore, full credits are granted here.
Claude 3.5 Sonnet
Total score: 16/20
1. Completeness (4/5)
Claude’s report was much shorter than ChatGPT, mainly because it did not display the visualizations, but only the text reports. However, it still covered most of the critical components of EDA.
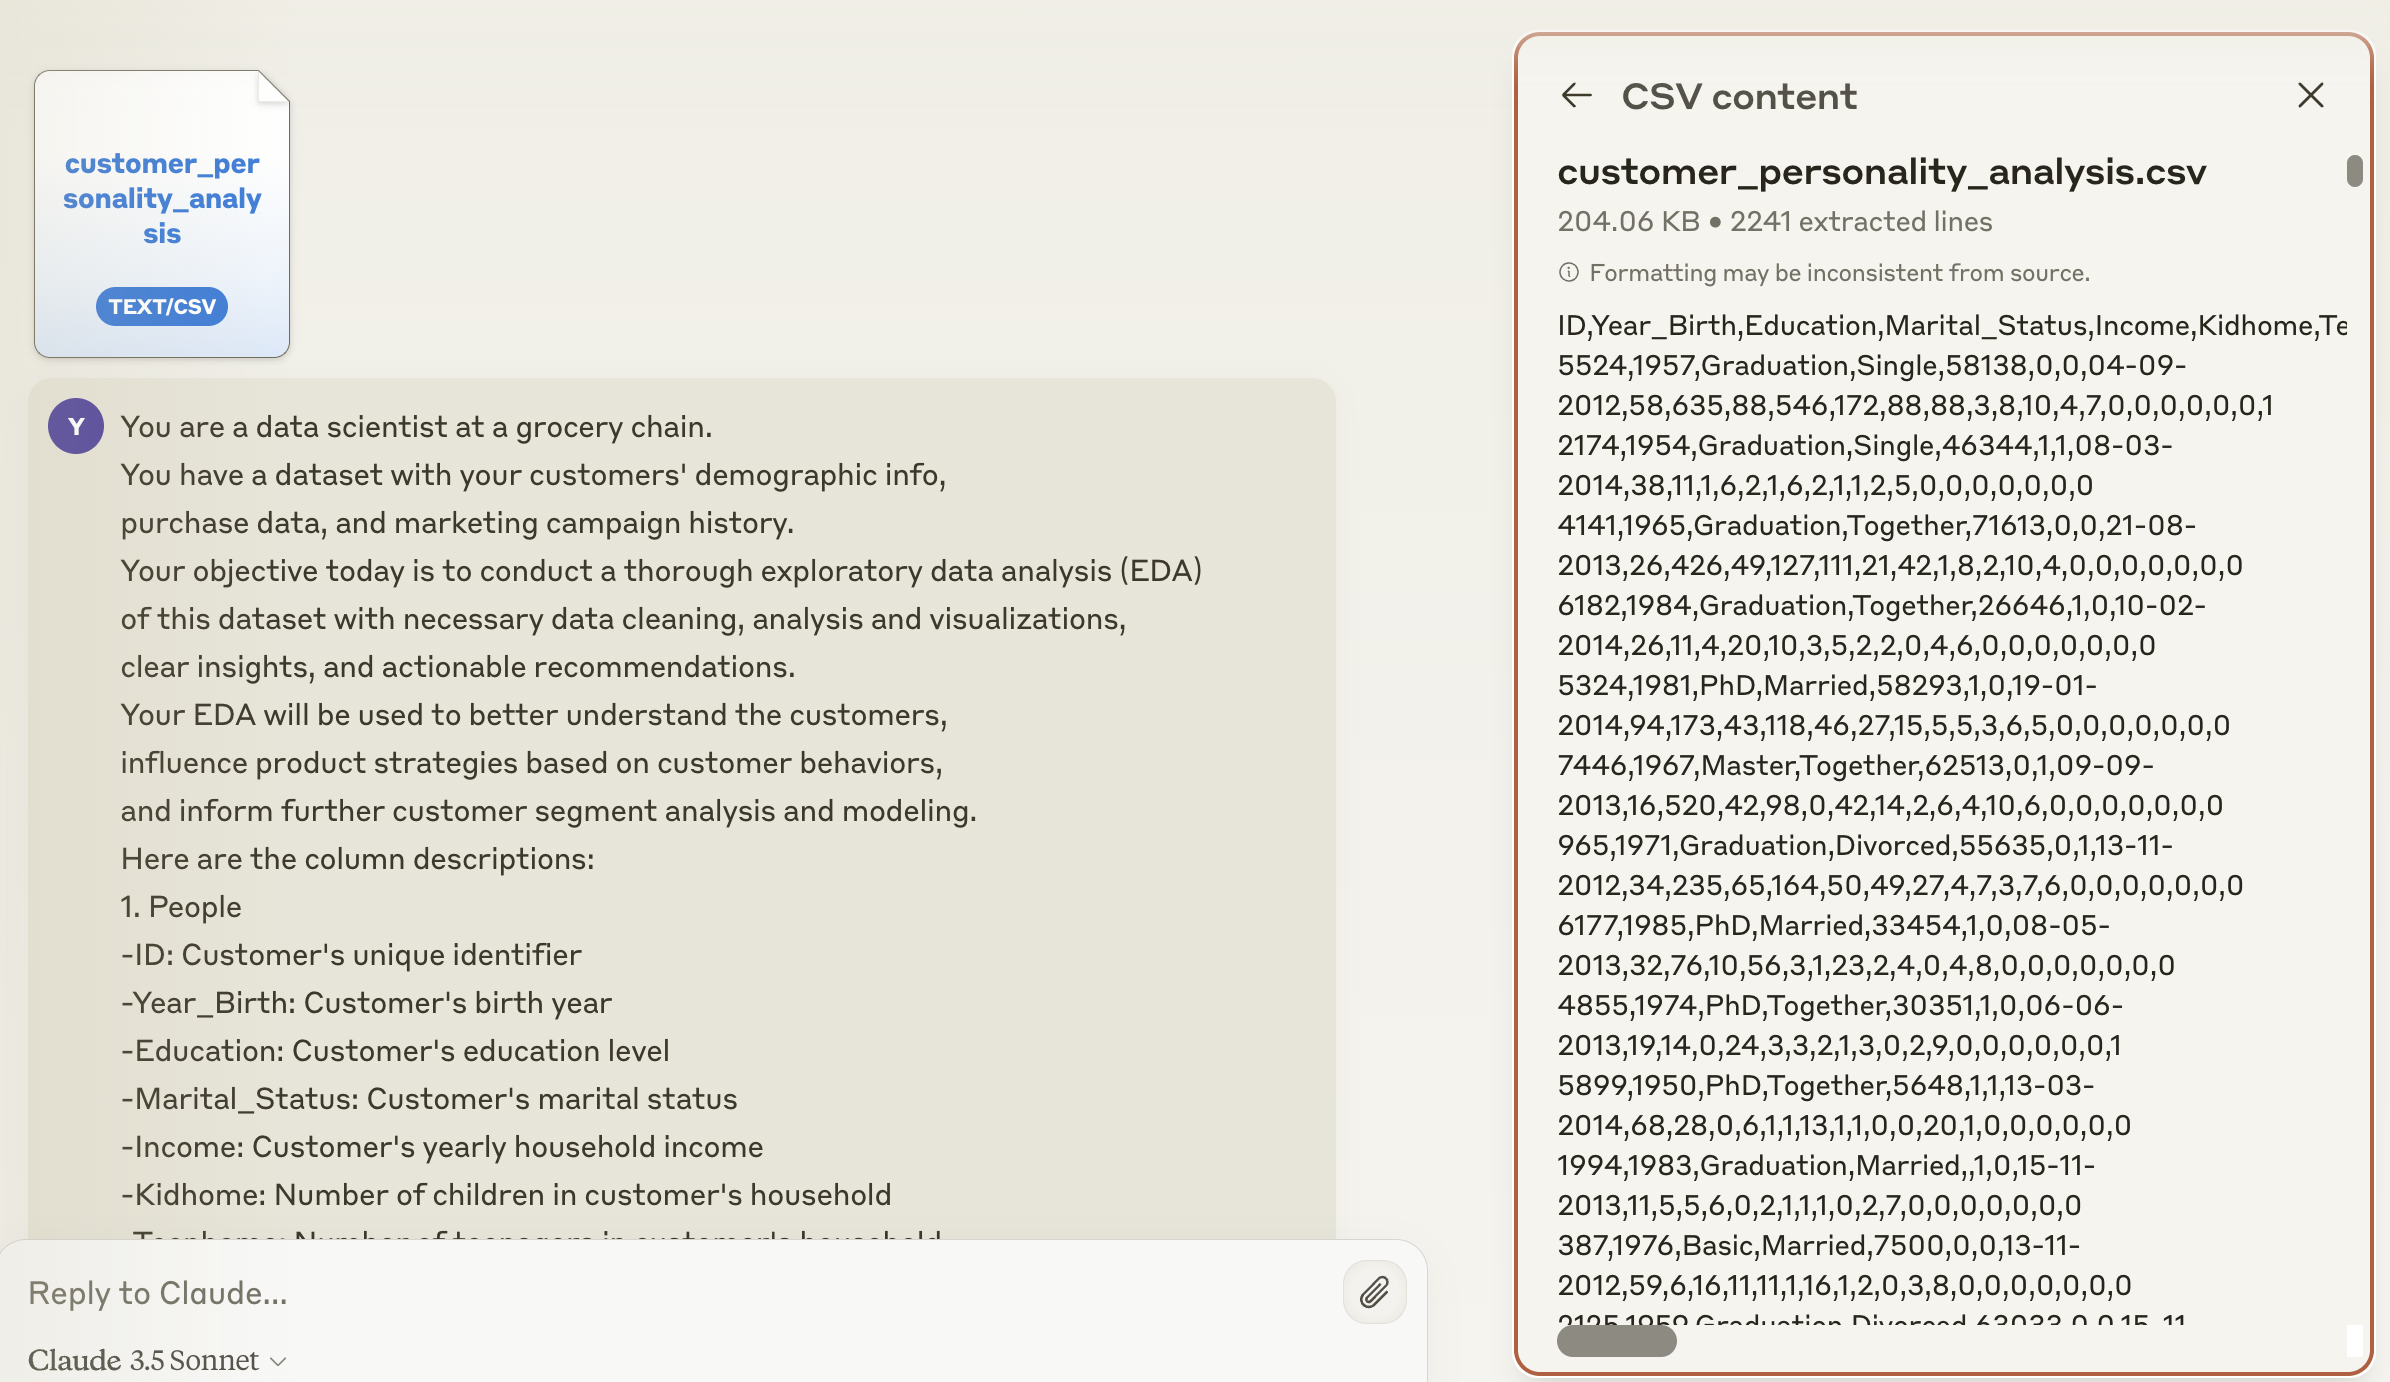
Data inspection: Although you could click on the uploaded CSV file, the preview was simply in text format, which was less digestible. Claude also did not provide any text description of the data structure. Therefore, I consider this step incomplete.
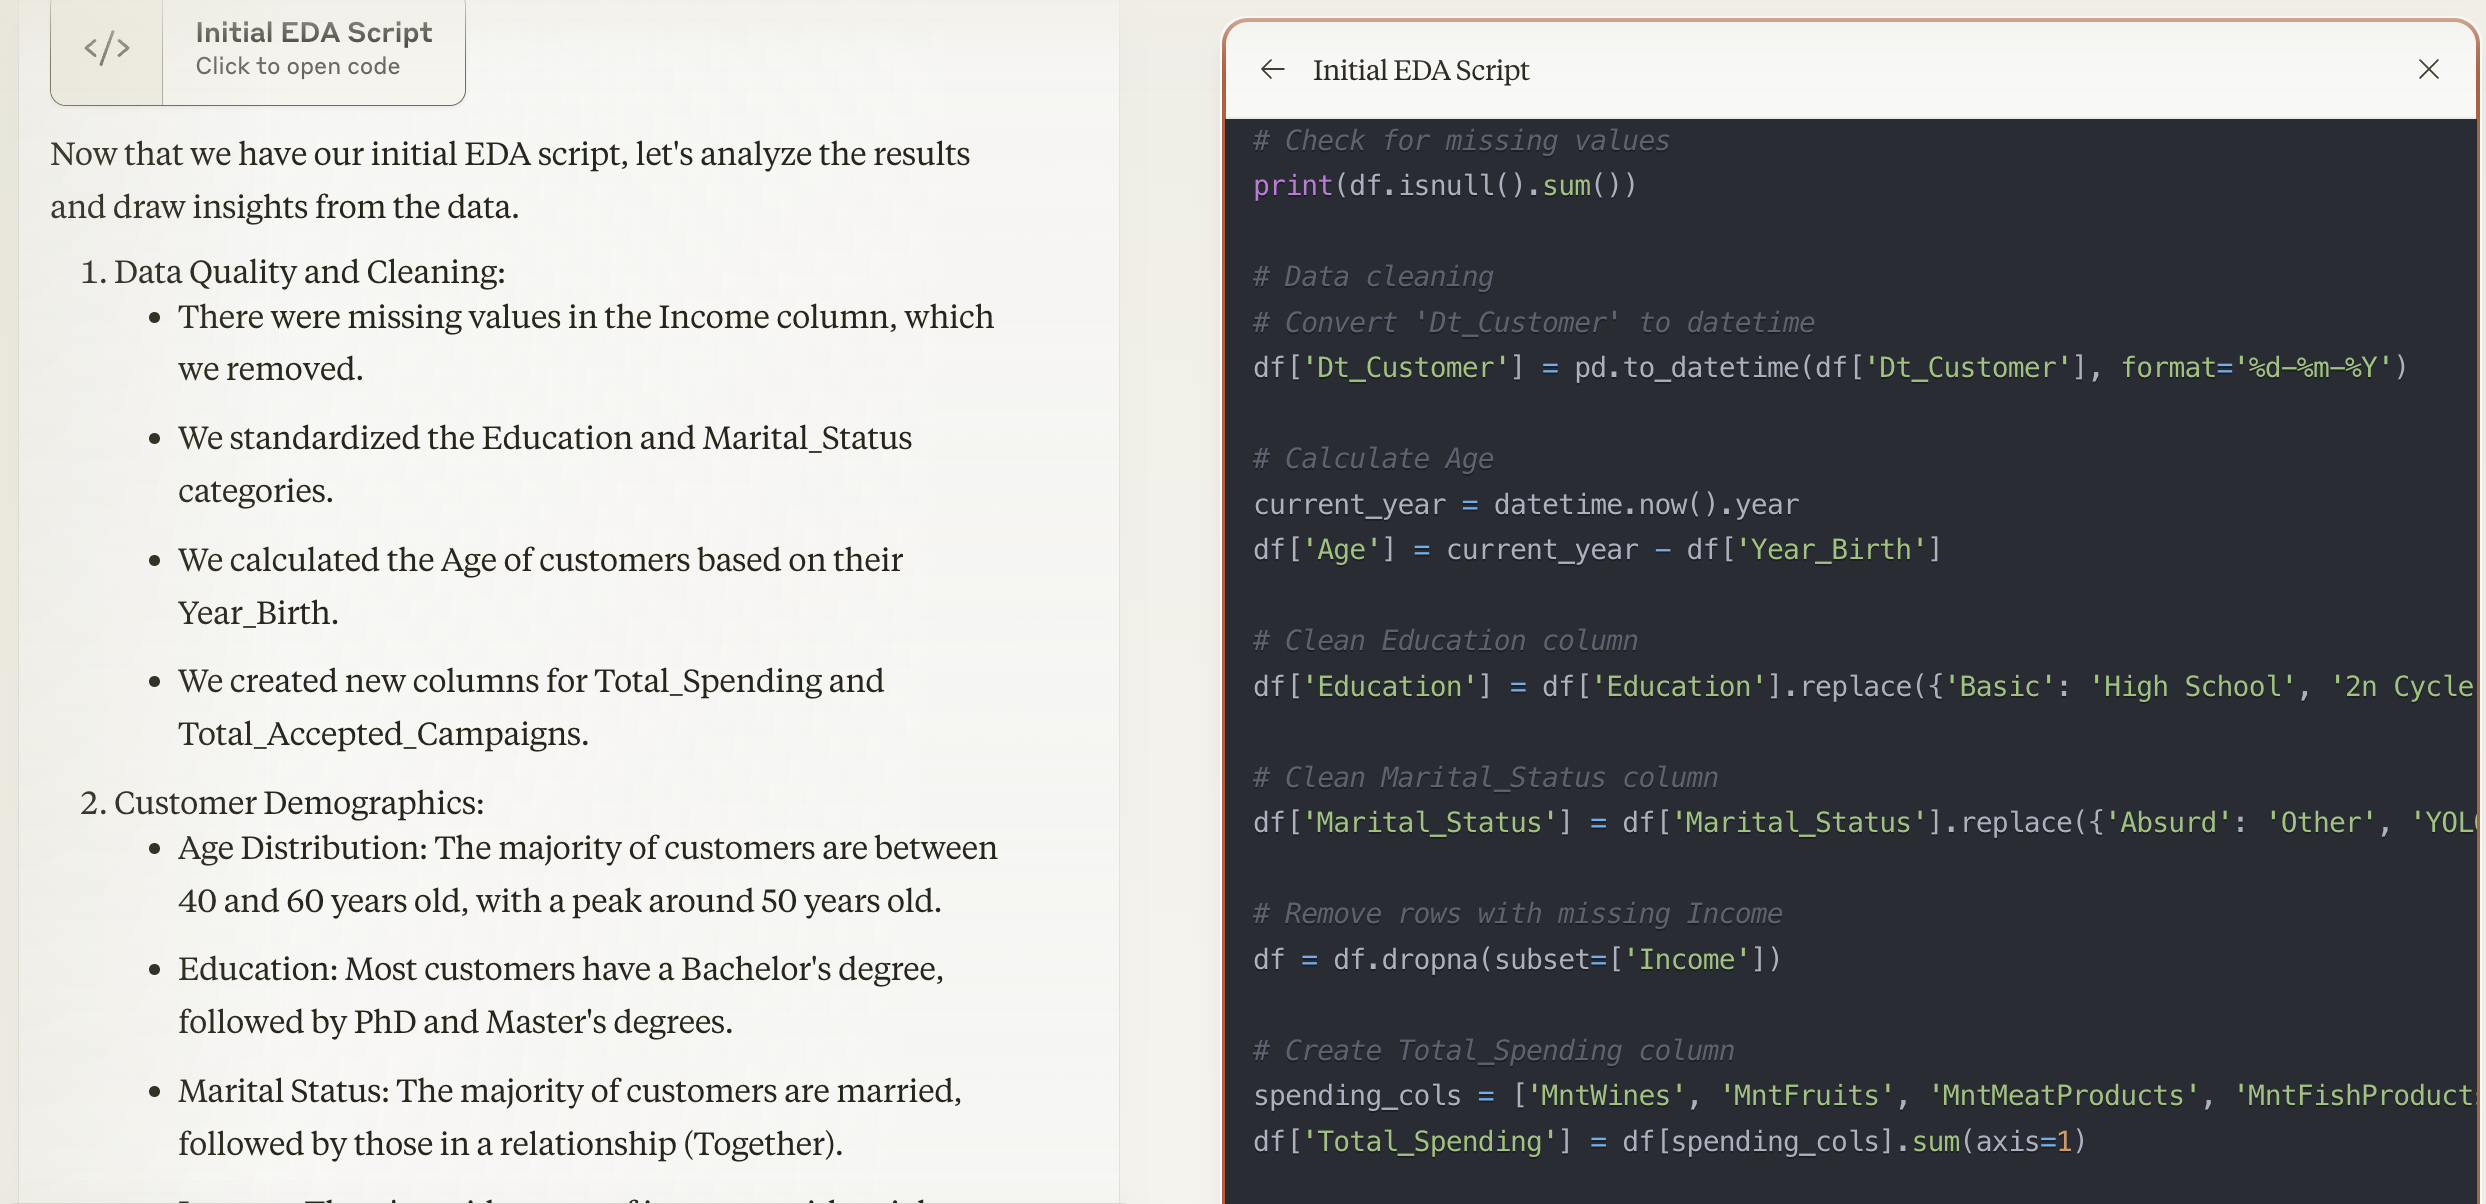
Data cleaning: Claude started its report with a “Data Quality and Cleaning” section, including steps like removing missing values, creating new columns, and cleaning up categorical values. You can clearly see the steps in the code snippet attached. Unlike ChatGPT, which chose to impute the missing income values with the median, Claude simply removed the rows with missing values. Given there were only 24 rows, I think both approaches were reasonable.
Univariate analysis: Claude included univariate analysis code within its Python script and mixed the insights in its report.
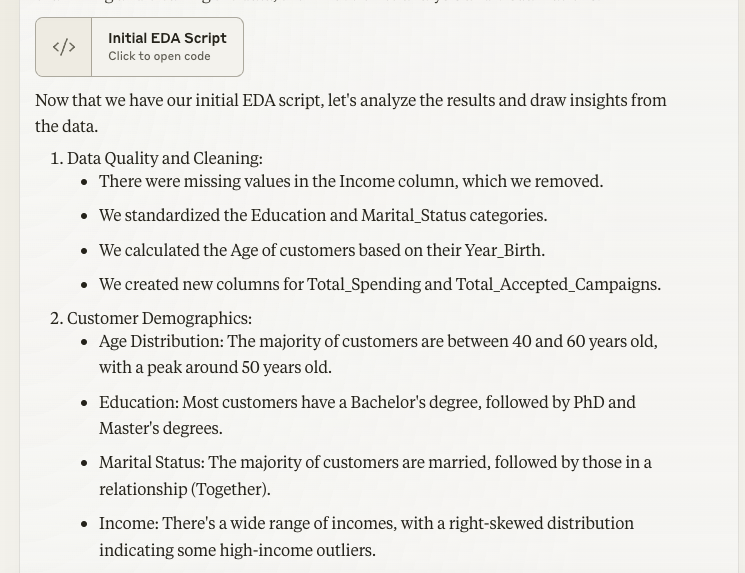
Bivariate and multivariate analysis: Similarly, in the below screenshot you can see Claude’s findings from bivariate analysis and the corresponding code.
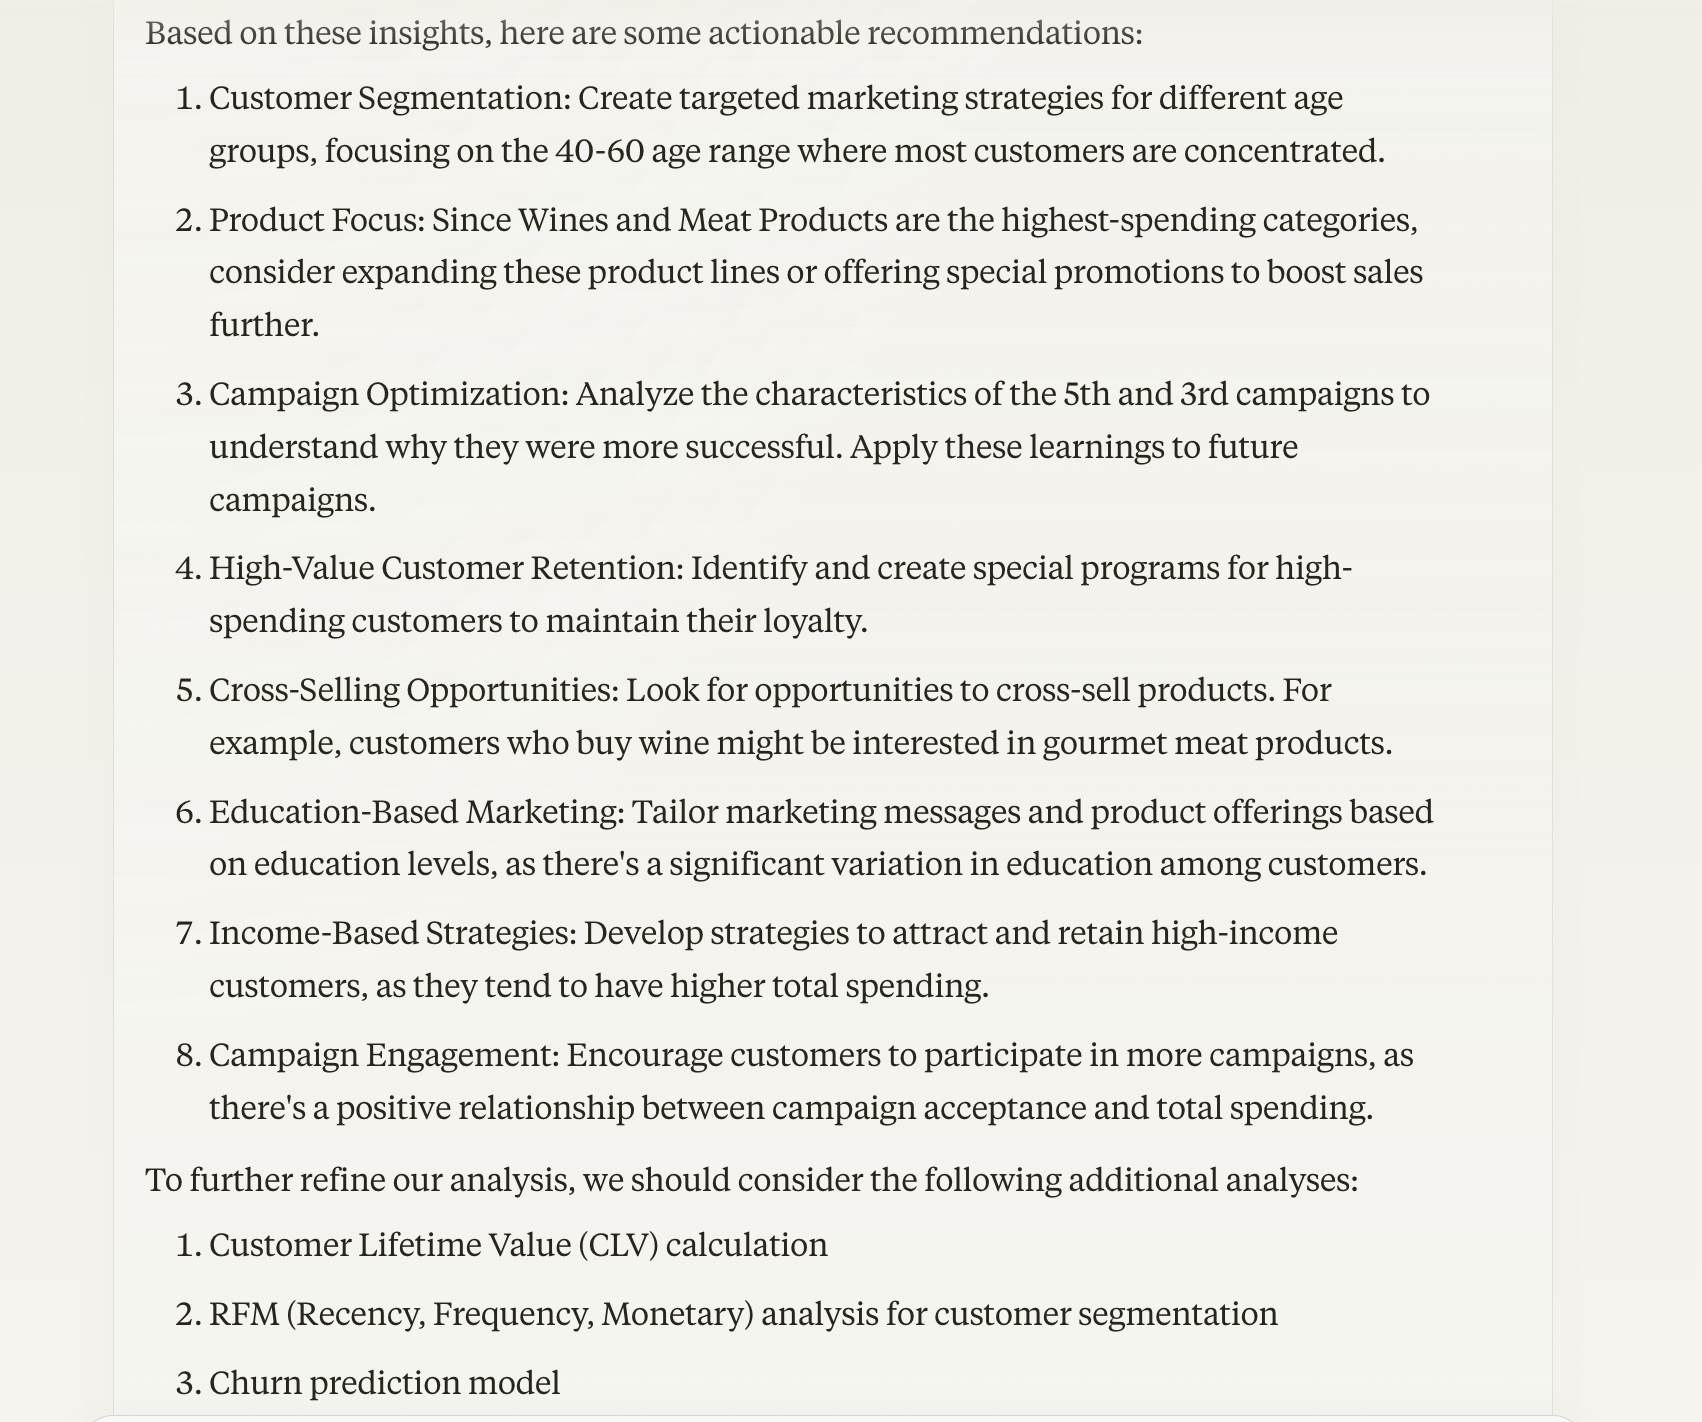
Insights and recommendations: After listing insights, Claude provided a comprehensive set of actionable recommendations with reasonable next steps.
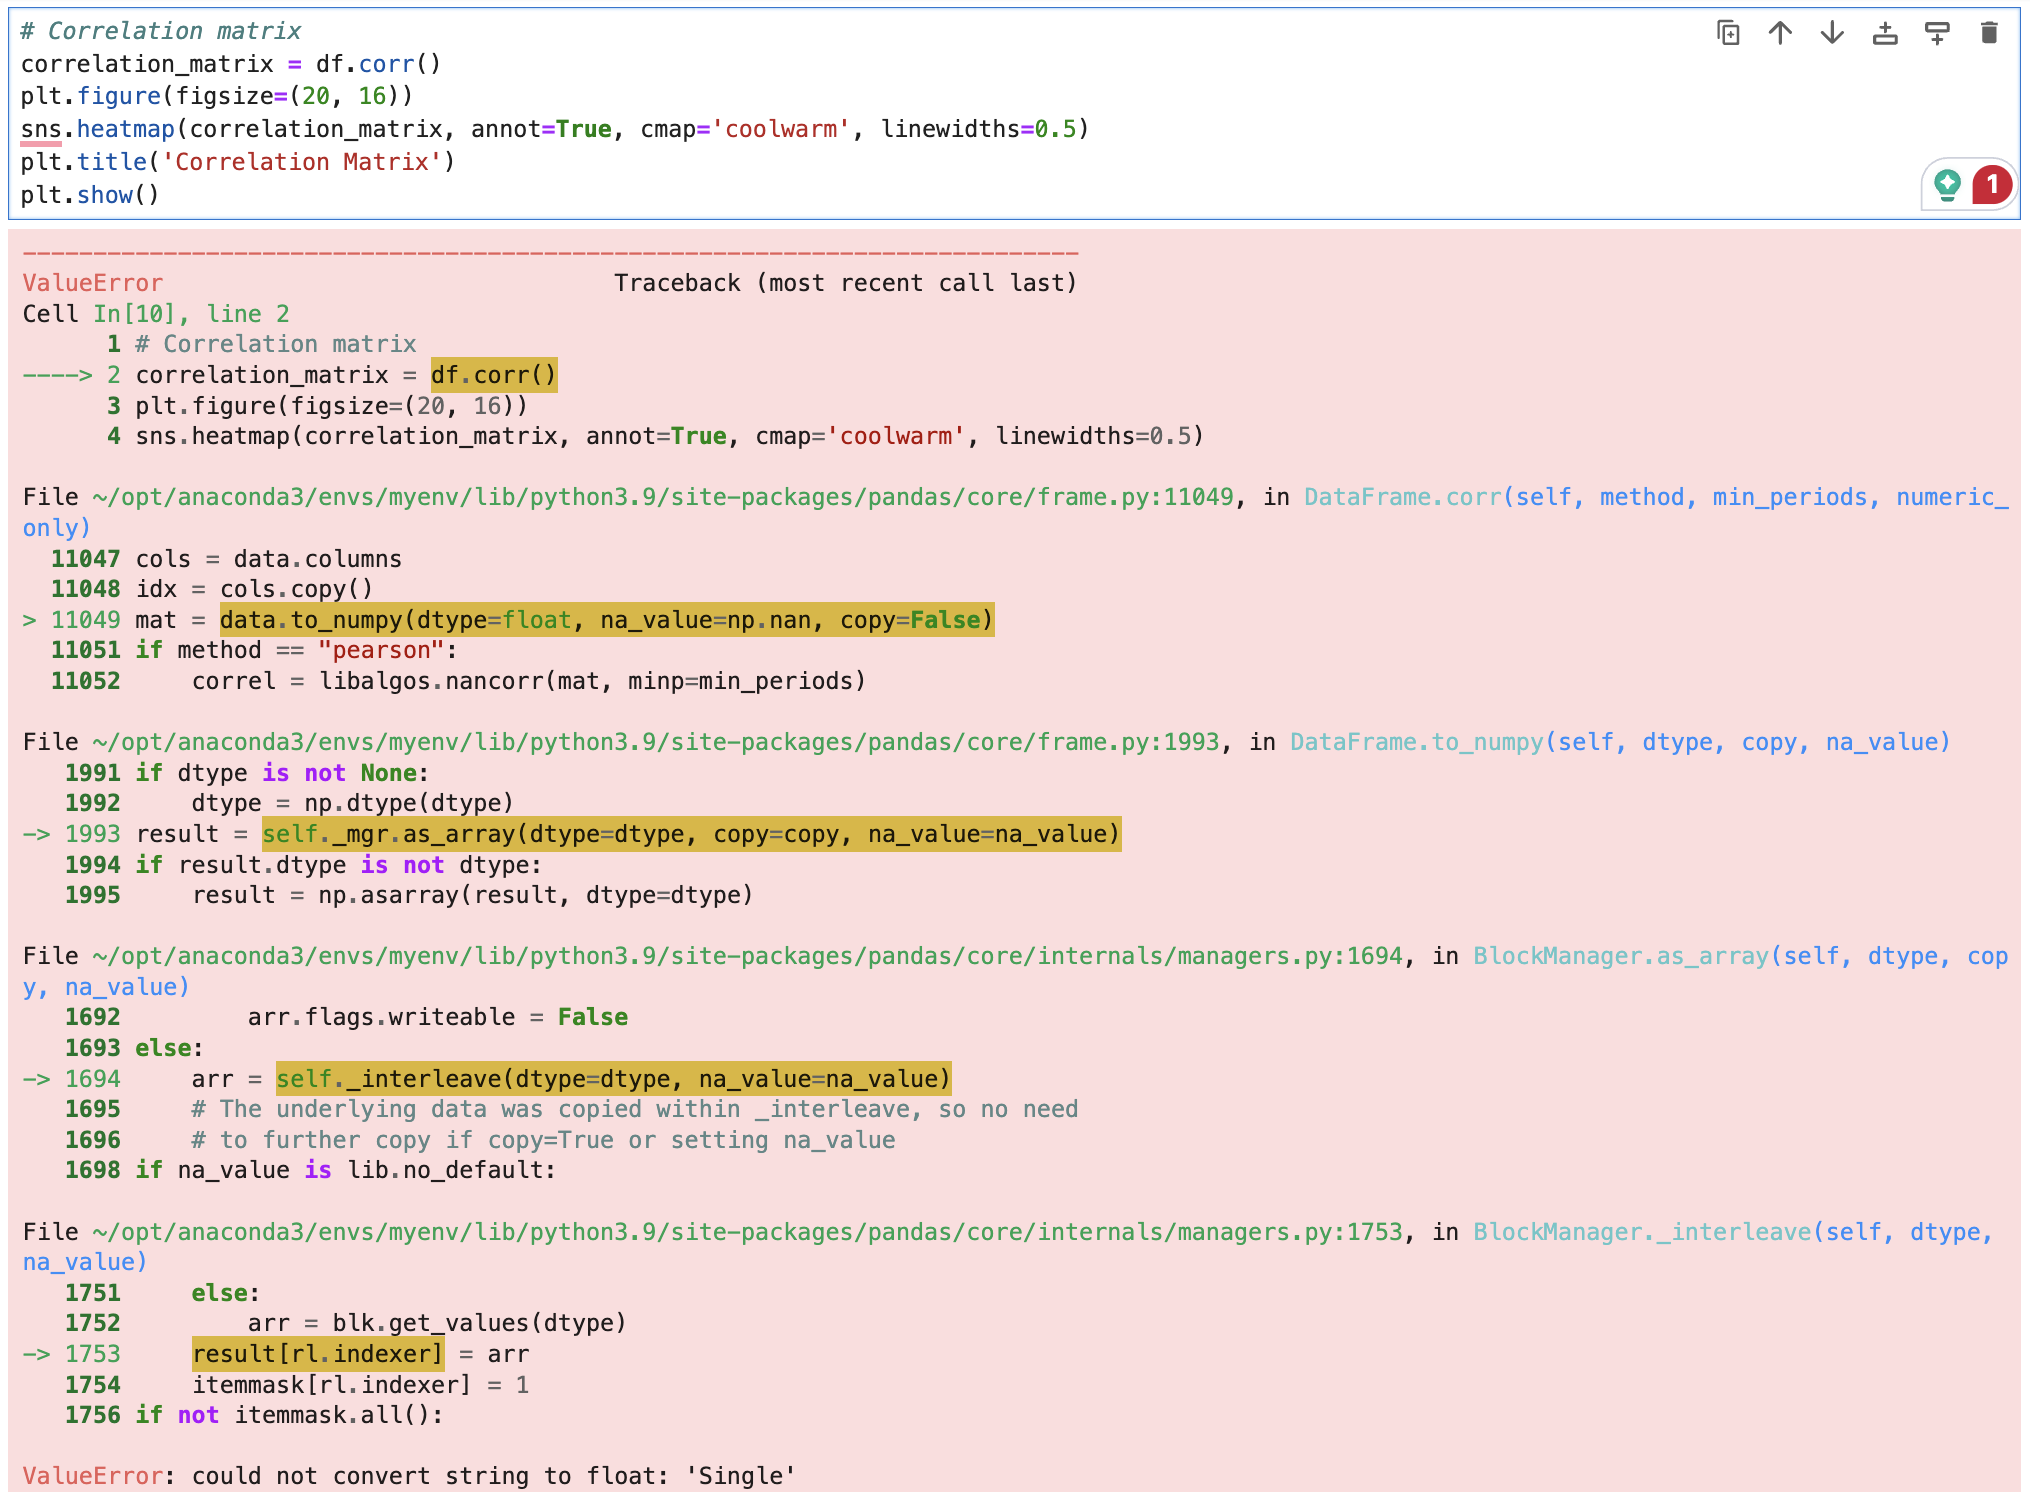
2. Accuracy (3/4)
I reviewed the Python script Claude generated and ran it manually. While most of the code was accurate, the correlation matrix section threw an error due to non-numeric columns being included. I shared a screenshot of this error with Claude, and it corrected the issue by adding df.select_dtypes(include=[np.number]) to filter on numeric columns only.
This minor error resulted in a one-point deduction.
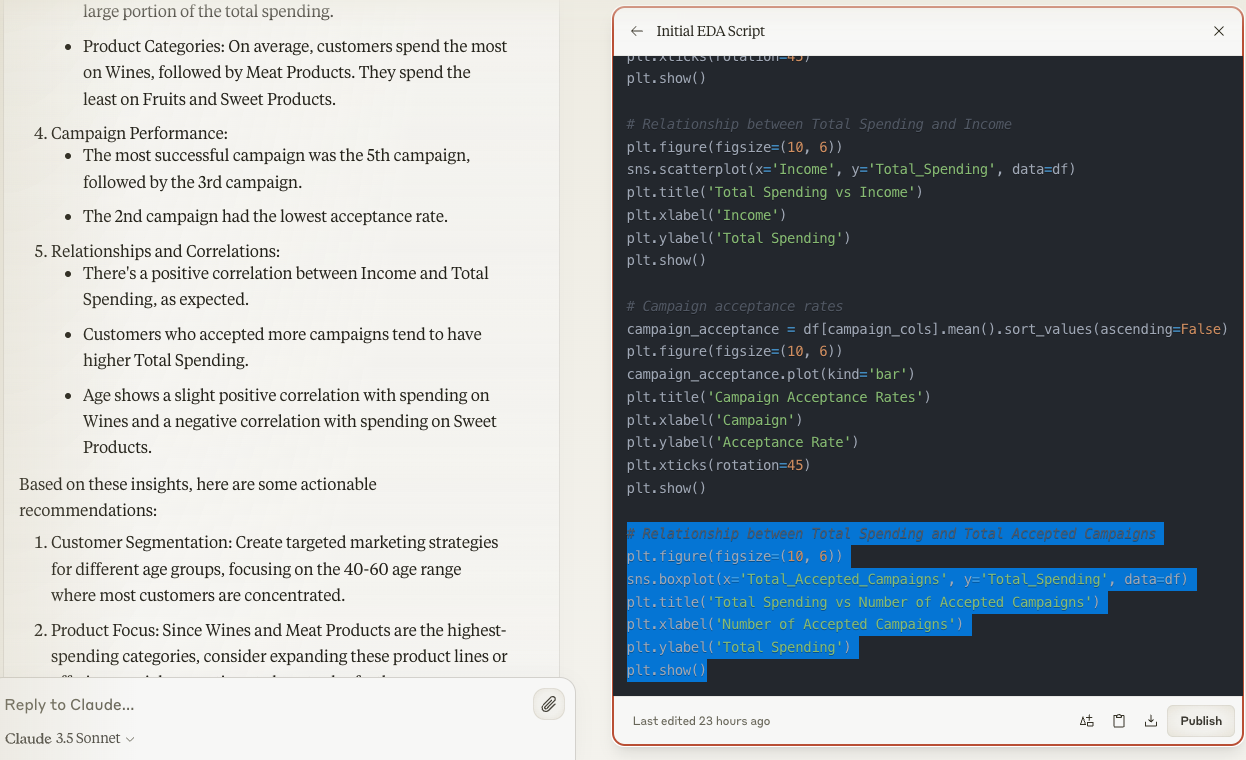
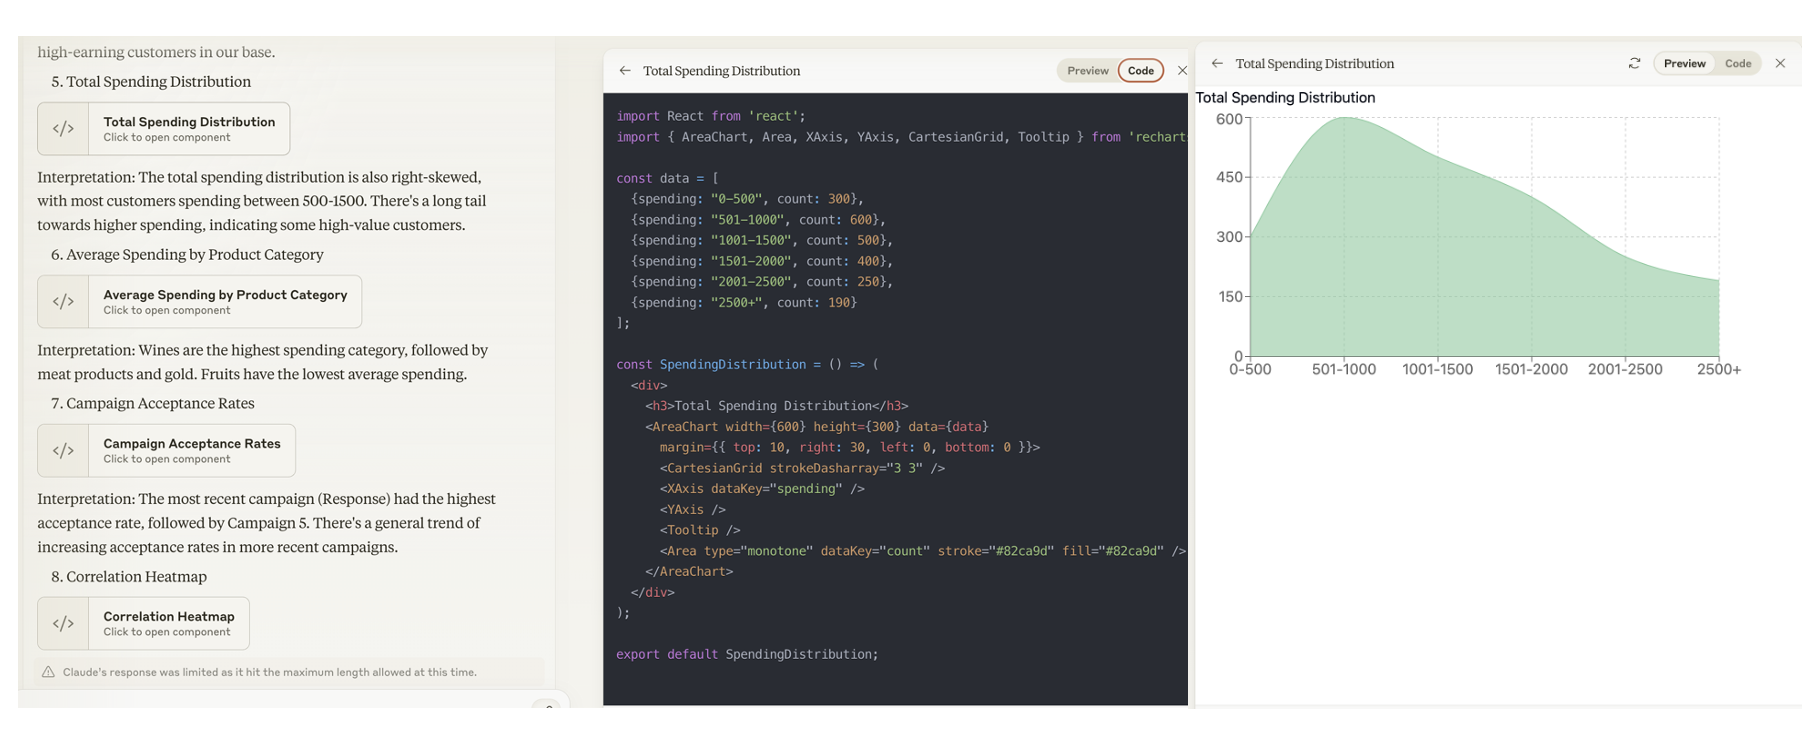
3. Visualization (2/4)
Unlike ChatGPT and Gemini, Claude did not display visualizations directly; it provided Python scripts instead. This is because it cannot execute Python code in the UI. But it does support running JavaScript and some other programming languages. I asked it to display the visualizations and it wrote JavaScript code with chart preview - but the hard-coded numbers in the script did not align with the dataset, leading to confusion…
I ran the Python scripts manually, and while they generated accurate visualizations (except for the correlation matrix error above), the overall experience was less user-friendly compared to the other tools. Therefore, I deducted two points for this limitation.
4. Insightfullness (4/4)
Despite the lack of visualizations, Claude’s recommendations were insightful and actionable, covering areas product focus strategy, campaign optimization, high-value customer retention and cross-sell opportunities. Full points were awarded for the quality of insights and recommendations.
5. Reproducibility and Documentation (3/3)
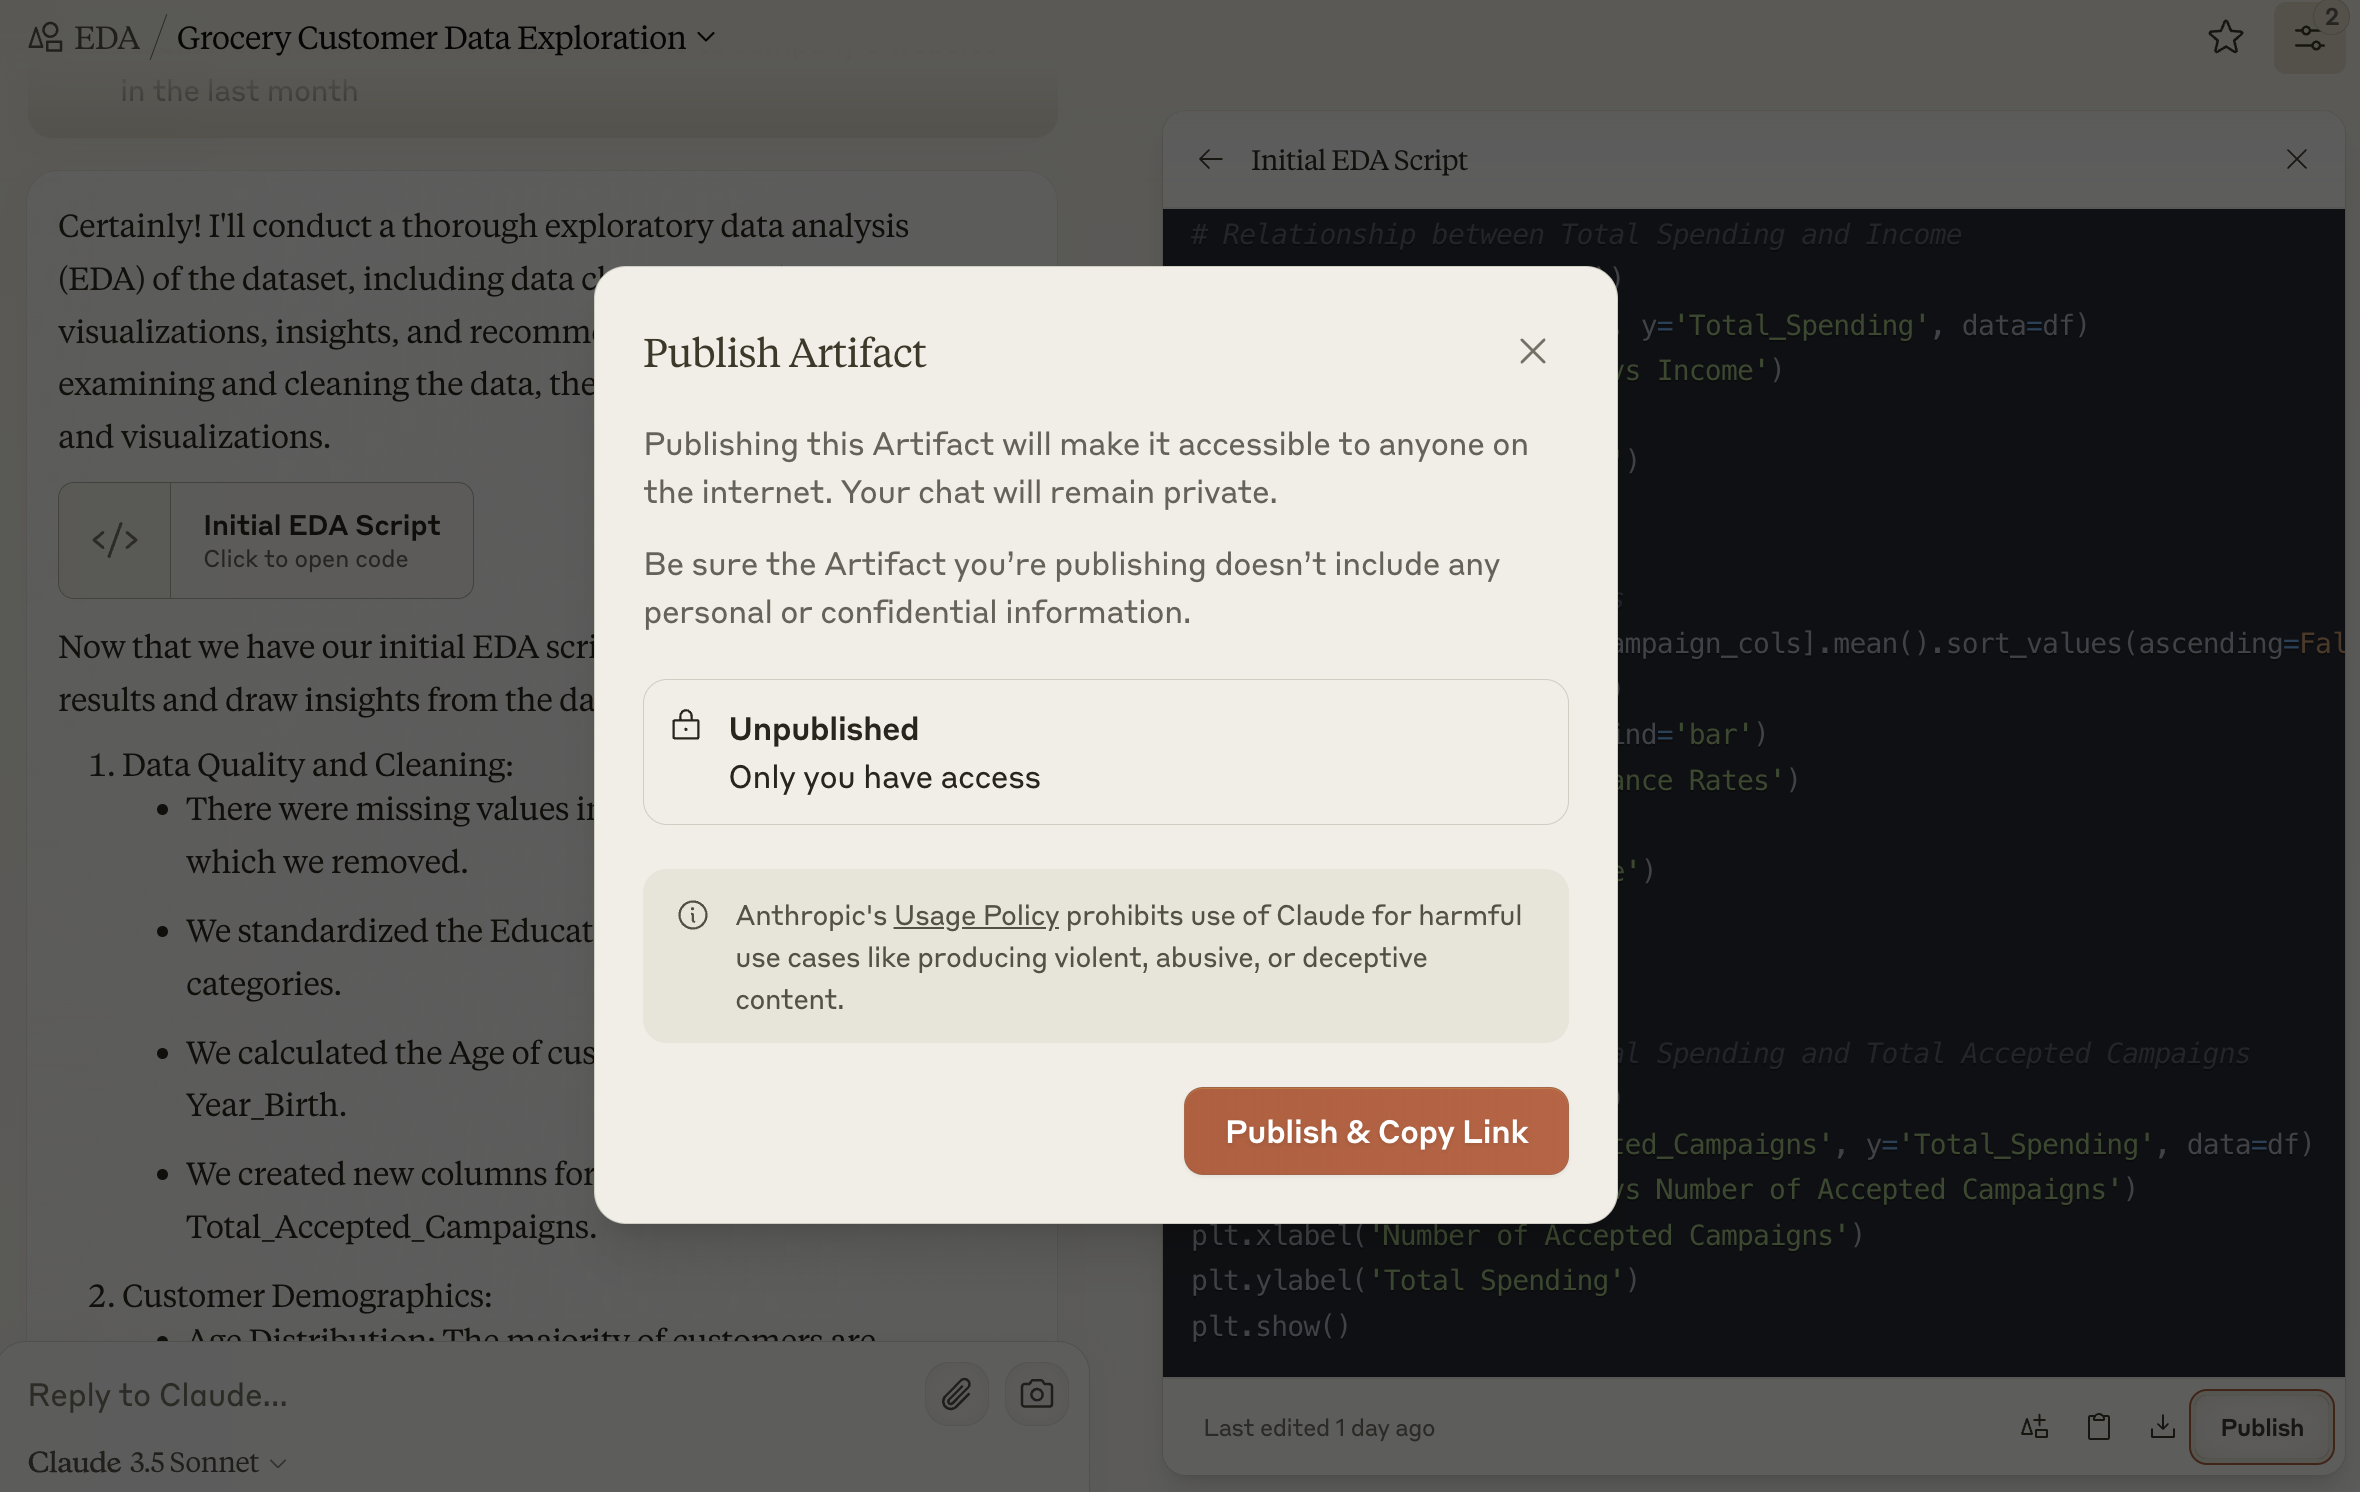
Claude’s response was clearly structured, with bullet points following the sequence of data cleaning, insights, recommendations, and next steps. The underlying Python code was accessible via the ‘Artifact’ window on the right. Artifact makes it easy to review and iterate on the code, reconcile it with the text report on the left, and even publish the code to share with others.
Gemini Advanced
Total score: 19/20
1. Completeness (5/5)
Gemini provided an exhaustive EDA, covering all critical components thoroughly.
Data inspection: You can open the CSV file in Gemini to review the dataset closely (though not as interactive as ChatGPT). Gemini also included a paragraph describing the data structure.
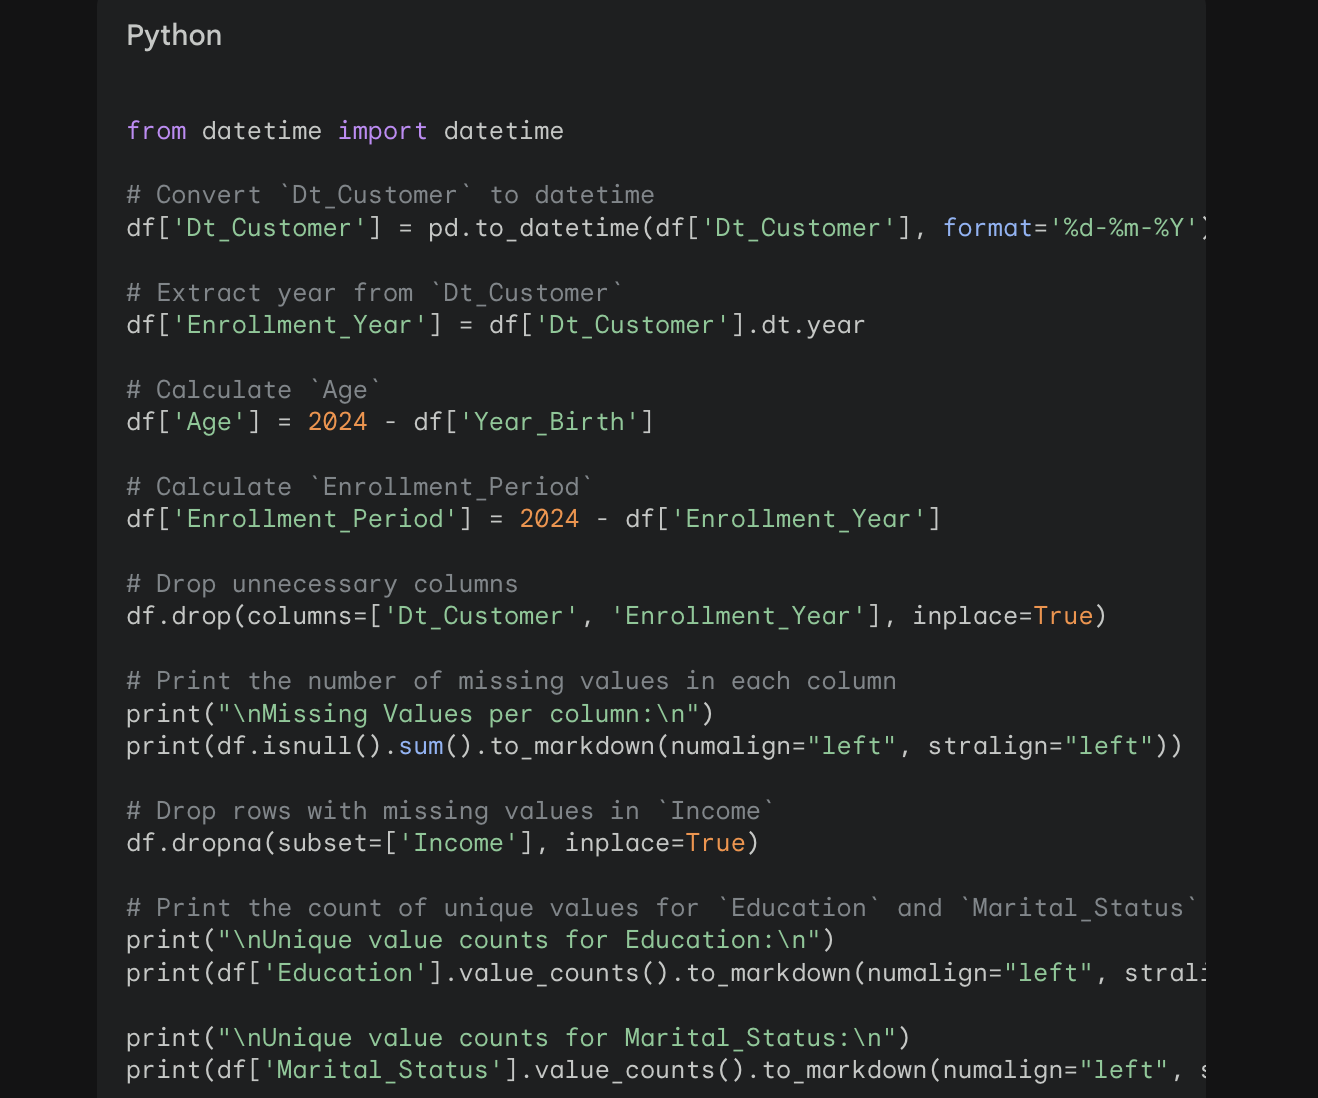
Data cleaning: Similar to Claude, Gemini corrected data types, calculated new columns (such as age and enrollment period), and dropped rows with missing values.
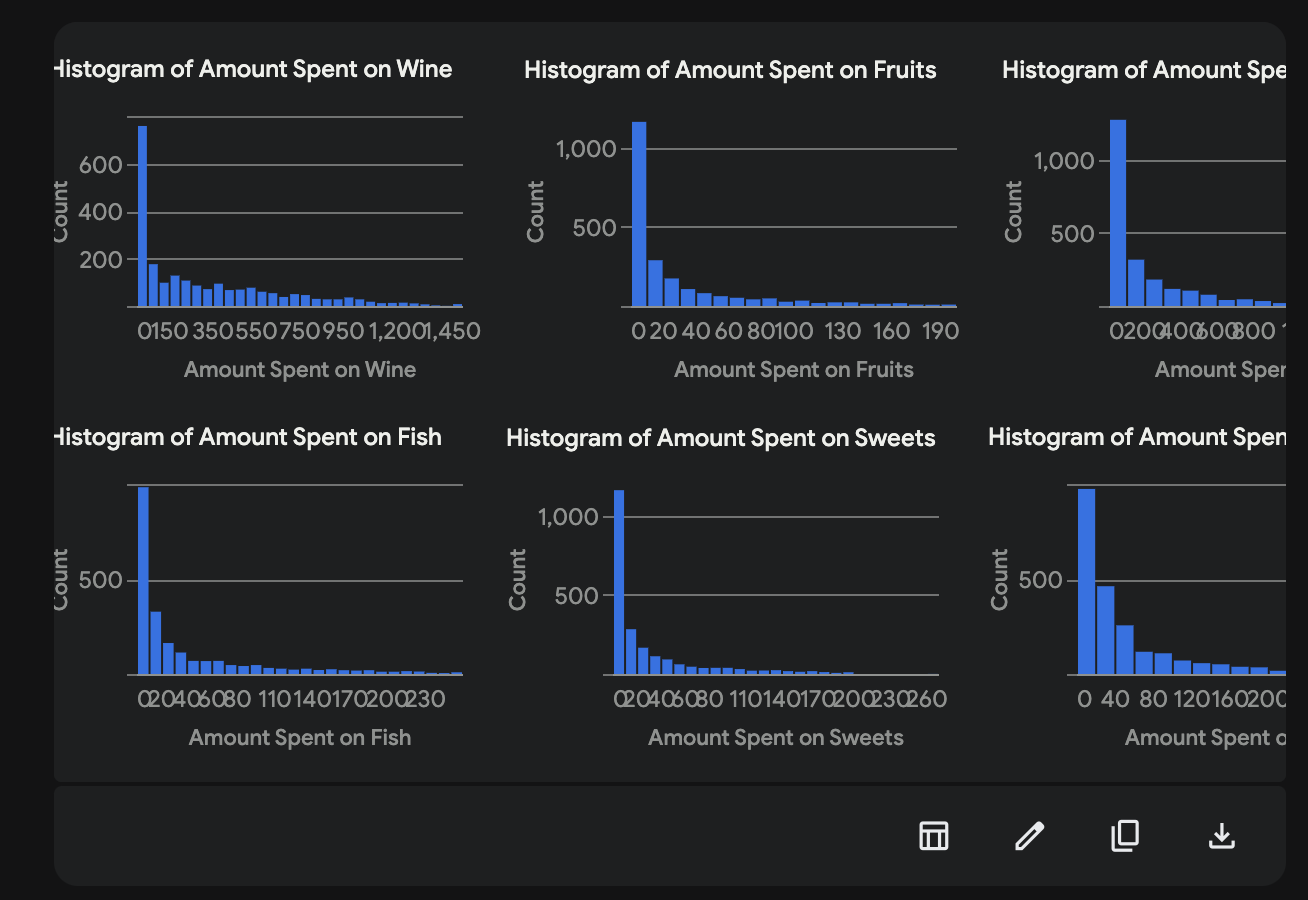
Univariate analysis: Gemini conducted an exhaustive univariate analysis and printed 10+ histograms and boxplots to explore individual variables.
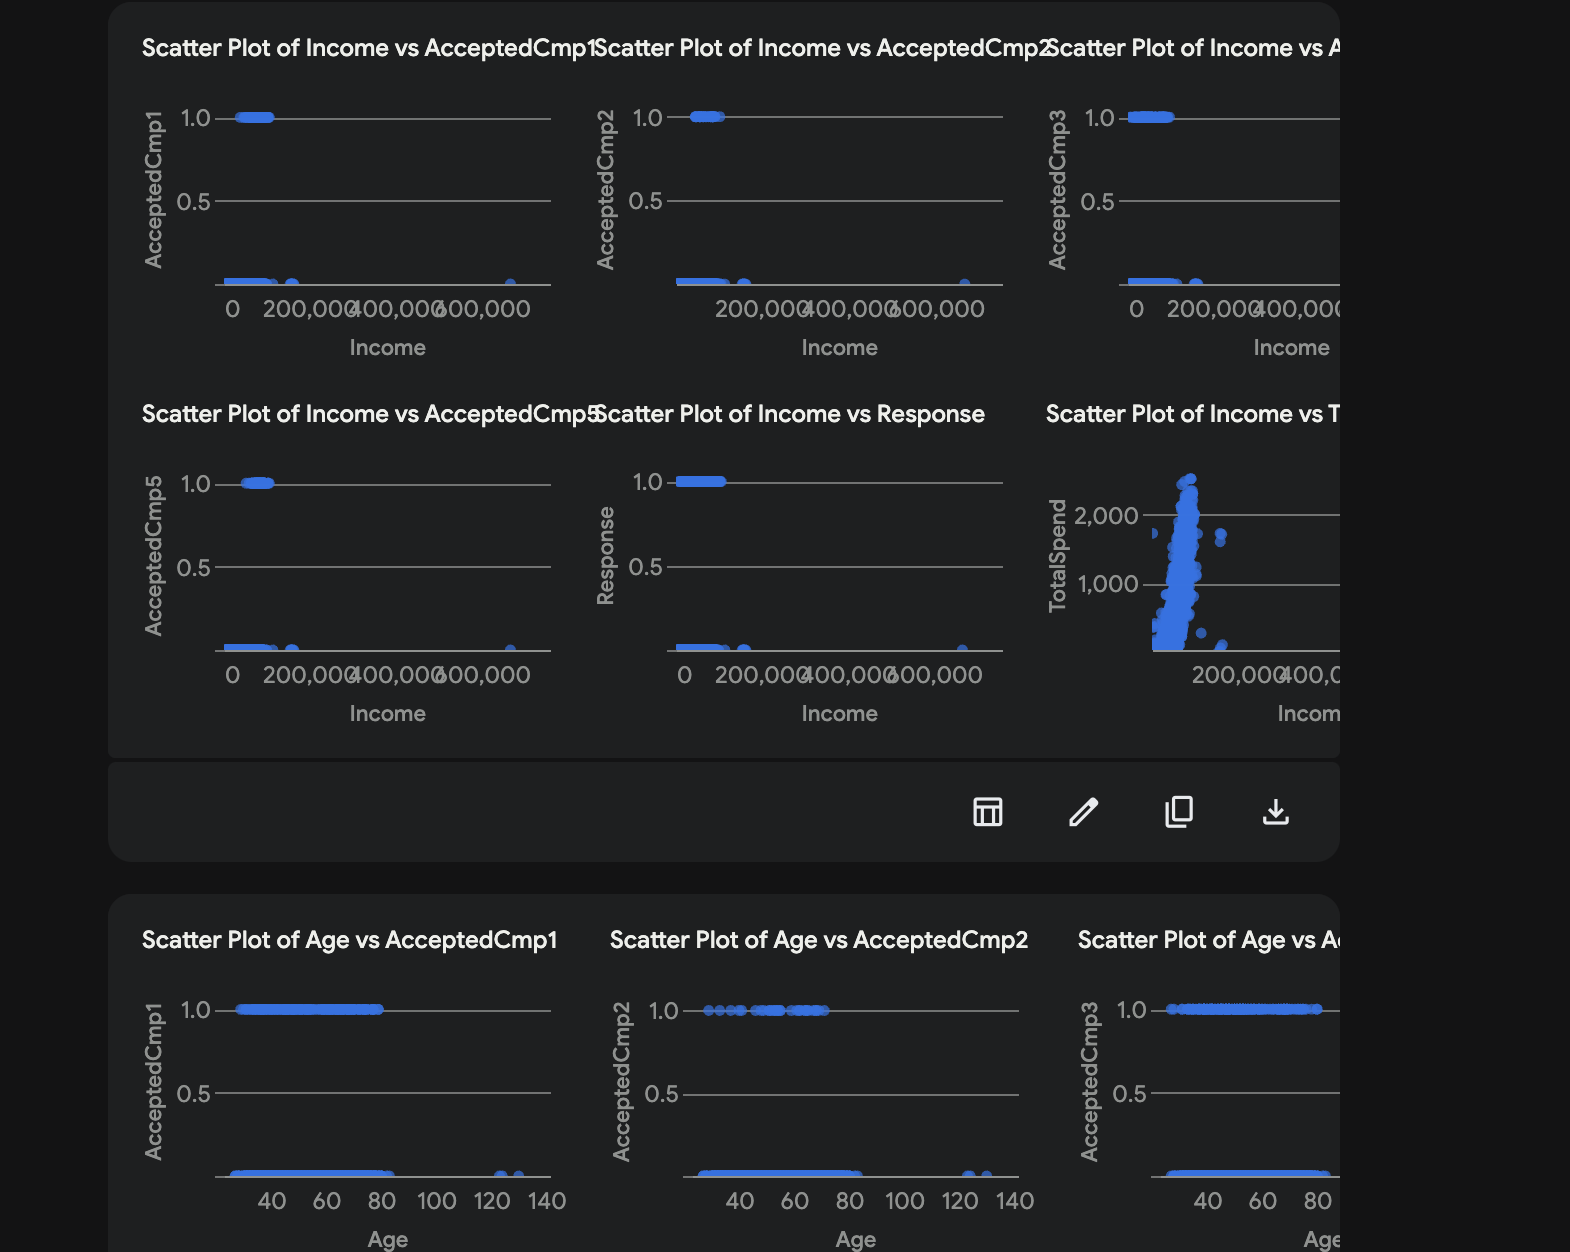
Bivariate and multivariate analysis: Gemini took a very thorough approach, generating over 50 visualizations across multiple grids, exploring nearly all possible variable pairs.
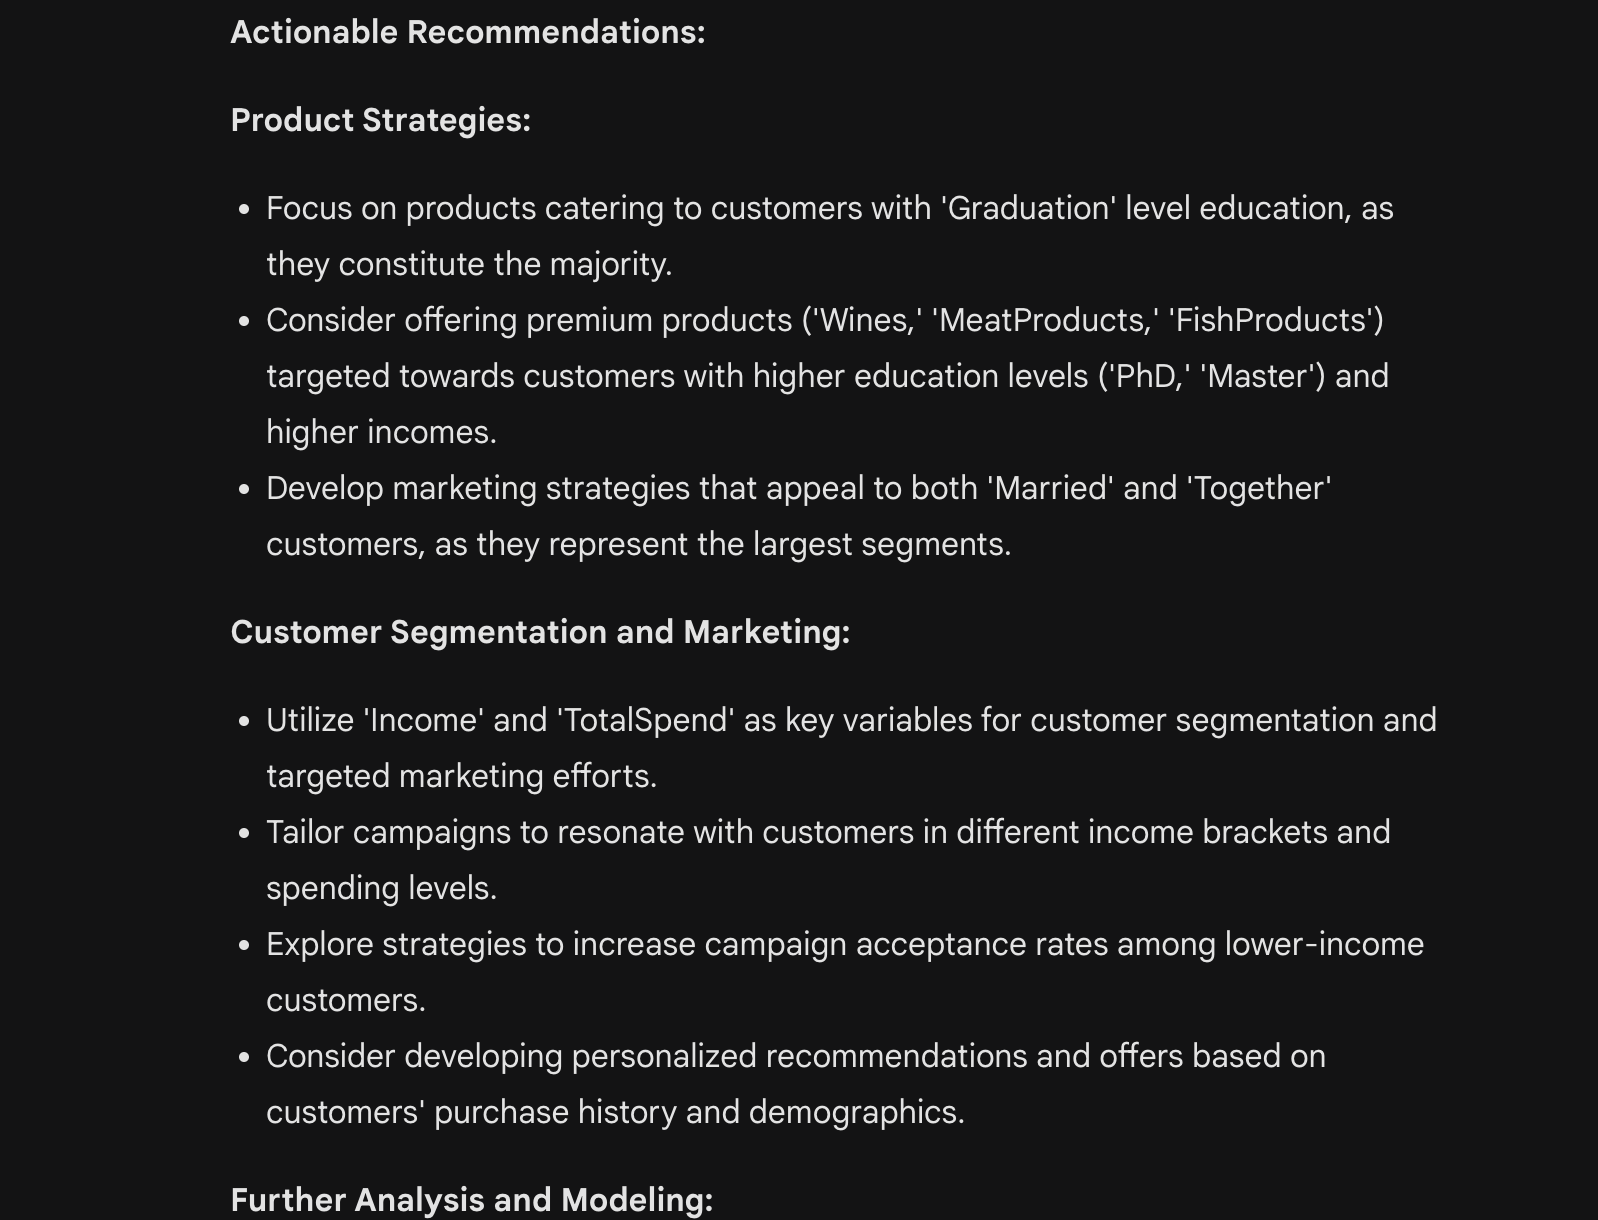
Insights and recommendations: After displaying all the visualizations, Gemini provided clear insights, followed by well-structured recommendations.
2. Accuracy (4/4)
Gemini attached clear and easy-to-follow Python code. After reviewing and running the code, everything checked out. Its insights also matched the visualizations, earning full points for accuracy.
3. Visualization (3/4)
Unlike ChatGPT and Claude, which used classic Python visualization packages matplotlib and seaborn, Gemini employed altair and saved the charts in JSON format to embed them in the chatbot UI. This made the charts highly interactive.
However, as shown in the screenshots above, its high number (50+) of similar-looking charts, coupled with overlapping labels, made it difficult to interpret the data effectively. As a result, I deducted one point for visualization.
4. Insightfullness (4/4)
Gemini summarised the key findings and provided actionable recommendations under two main categories - ”product strategies” and “customer segmentation and marketing”. These insights were actionable and well-aligned with the data, earning full points for insightfulness.
5. Reproducibility and Documentation (3/3)
Despite its response being longer than the other models due to the large number of visualizations, Gemini’s report was well-structured, and the attached Python code ensured that the analysis could be easily reproduced. This earned it full points for reproducibility.
Final Results
The winner is …🥁 ChatGPT-4o and Gemini Advanced - we have a tie!
The final scores among the three models were close, with even the 3rd place Claude 3.5 Sonnet earning a respectable 16 out of 20 points, which is 80% of the total score. It’s important to note that I conducted this competition with only one prompt! With guidance from data professionals, these tools’ capabilities can be significantly enhanced.
- ChatGPT-4o and Gemini Advanced: Both models lost just one point each. ChatGPT-4o was marked down for its limited interactivity in visualizations, while Gemini Advanced lost a point due to the cluttered nature of its visualizations.
- Claude 3.5 Sonnet: Claude’s main drawbacks were its inability to run Python code and display visualizations directly, along with a minor bug in its Python script. However, with its ability to run other programming languages like JavaScript, we might see it support Python visualizations soon!
Additional Considerations
When choosing your EDA assistant, here are a few additional points to consider:
- Selective vs. Exhaustive EDA: Interestingly, ChatGPT and Claude tend to focus on selected columns they deem important, offering a more digestible and focused report; Gemini, on the other hand, provides an exhaustive analysis, generating a wide range of charts. Each approach has its pros and cons: a selective analysis is easier to follow, while an exhaustive one offers comprehensive coverage, which can be overwhelming. So it’s up to you which style you prefer.
- Output Stability: I ran the same prompt with the same dataset three times in each tool so that I don’t bias my evaluation towards a single run - their response changes every time given the nature of LLM. This also makes me notice their different levels of output stability. Gemini showed the highest variance, with different report structures and content in each run. It generated a correlation matrix heatmap in one of the three runs and in another run, it even conducted a K-means clustering. Meanwhile, ChatGPT and Claude were more consistent, though they also varied in their choice of visualizations and insights. Therefore, if you’re relying on LLMs for generating insights, it might be wise to run the same prompt multiple times to ensure you get the best possible output (and of course, you can always follow up and explicitly ask for anything missing)…
- Response Speed: Among the three, ChatGPT-4o was the fastest - it started responding almost immediately. Claude was slightly slower, taking about 10 to 20 seconds to kick off. Gemini took the longest time to start and to finish, given the huge number of charts it generated, but still below 3 minutes.
Conclusion
If you’re looking for a quick, clear EDA report, ChatGPT-4o is the way to go. But if you prefer an exhaustive exploration of your dataset and can tolerate less polished visualizations, Gemini Advanced might be the better option for you.

