
Build a RAG-Based Chatbot to Retrieve Visualizations in 3 Steps
A step-by-step guide to creating a visualization discovery chatbot with OpenAI API, FAISS, and Streamlit
Over the last six years, I’ve embarked on a journey of creating a new data visualization every week - over 300 of them, to be precise! (You can read more about my journey here). This vast collection is like a treasure trove, but the downside? Finding that one specific visualization I know I’ve created can feel like searching for a needle in a haystack, especially when my Tableau repository is overflowing.
That’s when the idea hit me: What if I could use LLMs to help me retrieve visualizations based on specific topics? This sounded like a perfect use case for RAG(Retrieval-Augmented Generation).
In this article, I’ll walk you through the three simple steps I took to build a RAG-based chatbot. You can check out the demo below and even play with my app on Streamlit 👀.
What is RAG
RAG stands for Retrieval-Augmented Generation. It’s a technique that enhances the capabilities of LLMs by combining them with a retrieval mechanism. Essentially, RAG works in three major steps:
- Indexing: It first processes and indexes data from a knowledge base or dataset, often by creating embeddings or other similarity measures. This allows for efficient retrieval later on.
- Retrieval: It then retrieves the most relevant information from the indexed data based on a user query.
- Generation: Finally, it uses this retrieved information to generate a coherent and contextually appropriate response.
RAG is particularly useful for providing domain-specific knowledge that LLMs might not inherently “know” and for avoiding hallucinations, a well-known challenge for LLMs. In our use case, leveraging RAG allows us to create a chatbot that not only understands user queries but also retrieves and presents the most relevant visualizations from my vast collection.
Step 0 - Data Preparation
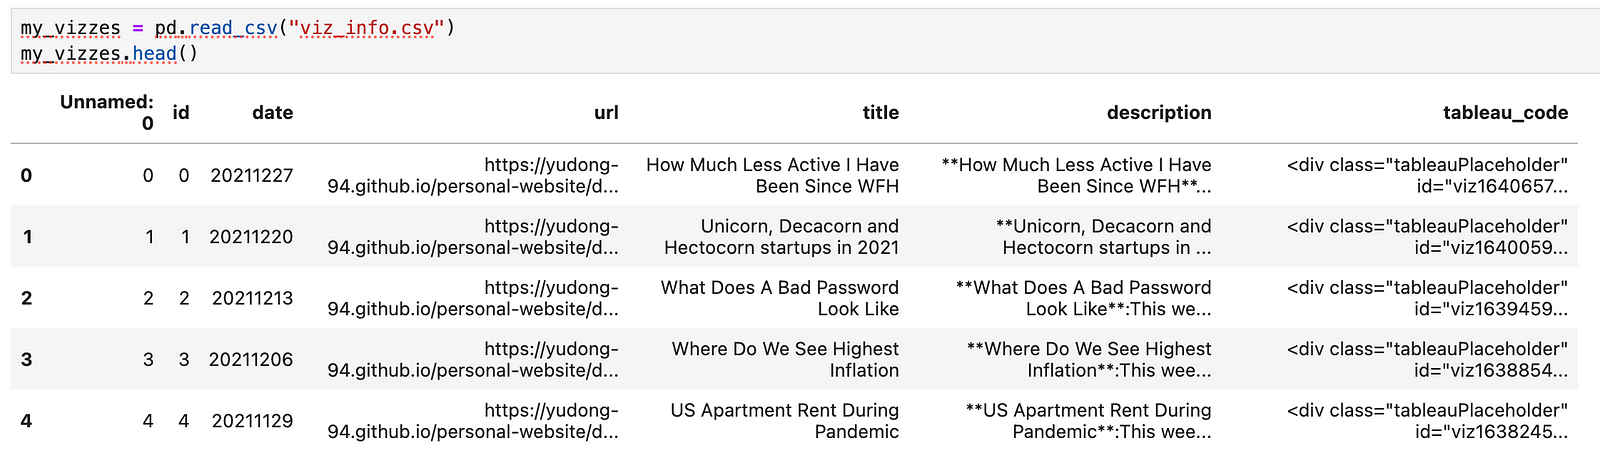
Before diving into building the chatbot with RAG, the first step is data preparation. Our goal here is to enable the chatbot to retrieve visualizations based on user queries. Therefore, we first need the visualization information. For this, I used a dataset containing all my weekly visualizations, along with a two-to-three-sentence description and the Tableau dashboard embed code, which we’ll use to display in the chatbot’s UI.
If you are curious about the data preparation process, feel free to check out my previous article: From Web Pages to Insights: Integrating Web Scraping and Text Analysis with GPT.
Below are the packages we will be using today. We will use FAISS to conduct data indexing, the OpenAI API to create embeddings and generate final responses, and StreamLit to build the chatbot app UI.
import numpy as np
import pandas as pd
import requests
import json
import faiss
import openai
import streamlit as st
Step 1 - Data Indexing
The first step of building the chatbot is data indexing, which involves generating embeddings for each visualization description. These embeddings will allow us to efficiently index the data and find the visualizations most relevant to a user’s query.
Let’s create a help function to get text embeddings from the OpenAI API embeddings endpoint.
def get_embeddings(api_key, text):
    '''
    This function gets the embeedings of a query from OpenAI API text-embedding-3-small model
    '''
    headers = {"Authorization": f"Bearer {api_key}"}
    data = {
        "model": "text-embedding-3-small",
        "input": text,
        "encoding_format": "float"
    }
    openai_url = "https://api.openai.com/v1/embeddings"
    response = requests.post(openai_url, headers=headers, json=data)

    return response.json()["data"][0]["embedding"]
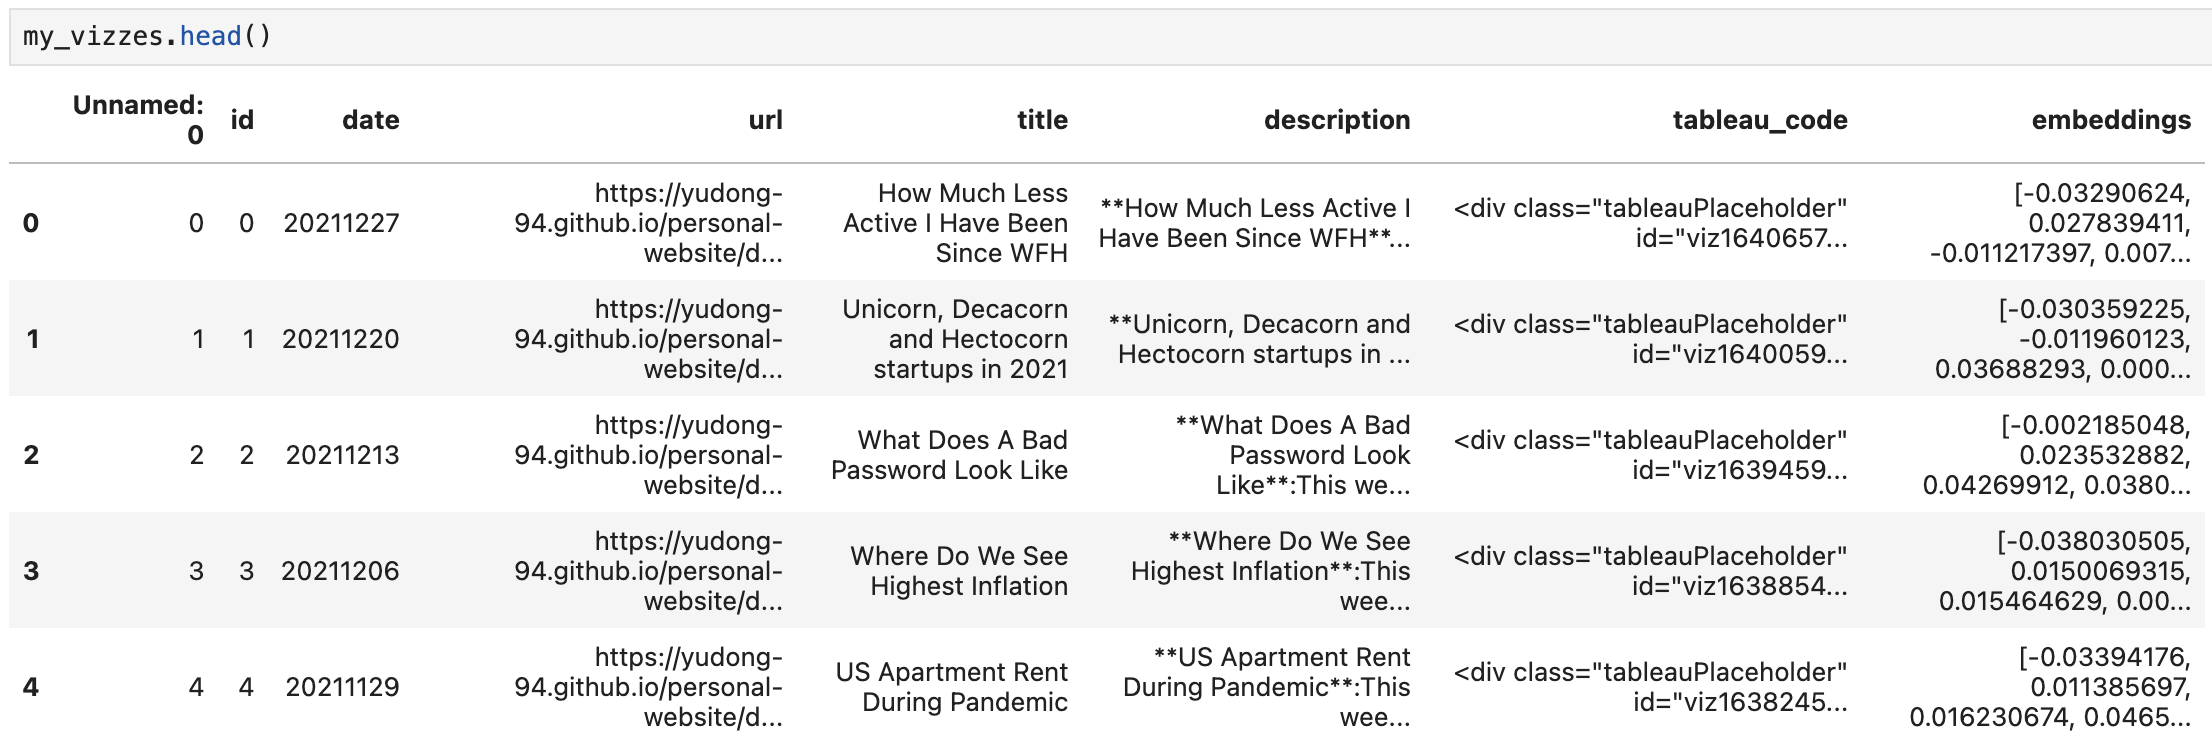
Next, we loop through all the visualization descriptions to get their embeddings. Normally, you would create embeddings on text “chunks”, but since each description here is brief, we can generate embeddings directly.
embeddings = []

for index, row in my_vizzes.iterrows():
    desc = row["description"]
    embedding = get_embeddings(desc)
    embeddings.append(embedding)


my_vizzes["embeddings"] = embeddings
Here is our updated data frame with embeddings:
Now let’s build data indexing with FAISS. FAISS is a library developed by Facebook AI Research that enables efficient similarity search and clustering of dense vectors, like our embeddings.
# Building the FAISS Index
# You can choose different types of indices based on your need for speed vs accuracy
# Here, we'll use an IndexFlatL2 index, which is a simple flat (brute-force) index
embedding_matrix = np.vstack(my_vizzes["embeddings"].values).astype('float32')
dimension = embedding_matrix.shape[1] # dimension of the embeddings
index = faiss.IndexFlatL2(dimension)
index.add(embedding_matrix) # Adding the emebddings to the index
Step 2 - Retrieval
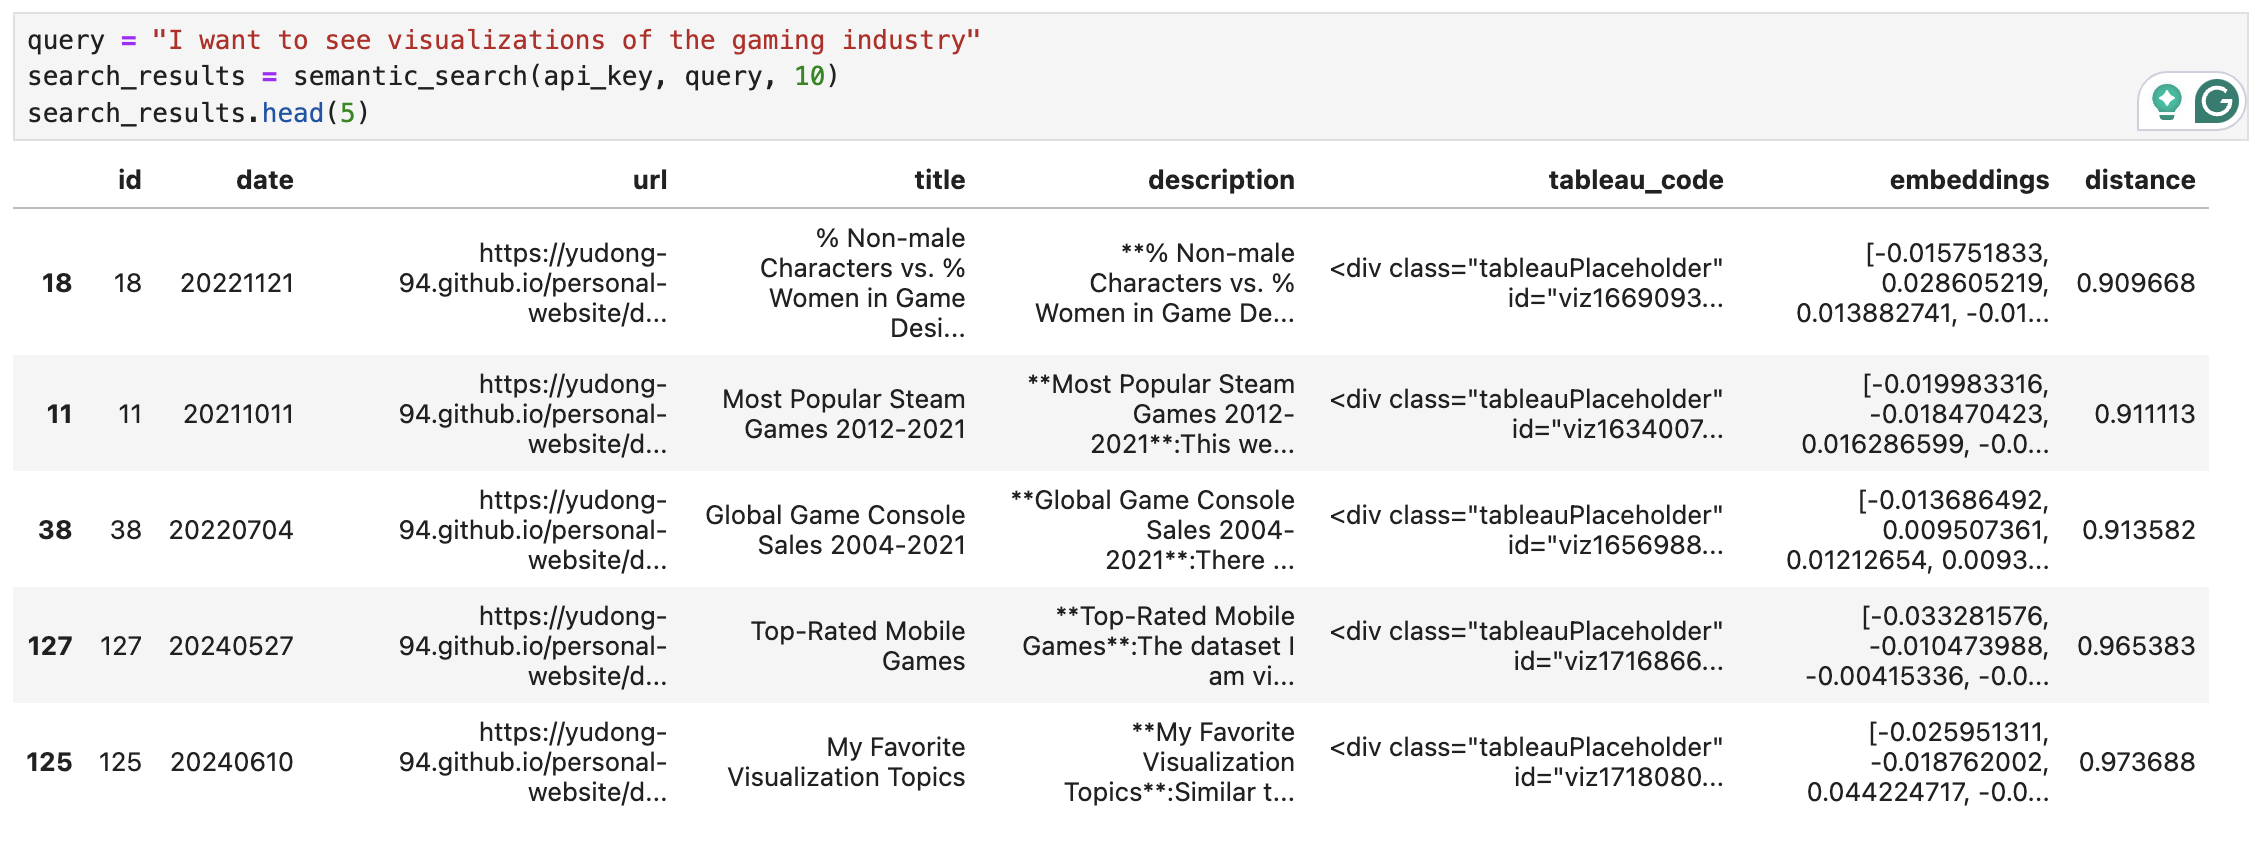
In the next step, we will retrieve visualizations that are most relevant to the user query using the FAISS index we have created. To do that, we will get the embedding of the user query and then find the visualization descriptions with the closest distances.
def semantic_search(api_key, query, k):
    '''
    Get the top k similar text to the query
    '''

    # Get the embedding of the query from OpenAI API
    query_embedding_response = get_embeddings(api_key, query)
    query_embedding = np.array(query_embedding_response).astype('float32').reshape(1,-1)

    # Retrieve Results
    distances, indices = index.search(query_embedding, k)
    results = my_vizzes.iloc[indices[0]].copy()
    results.loc[:, "distance"] = distances[0]

    #print(results)

    return results
Step 3 - Generation
Now that we have a list of the most relevant visualizations, we can use it to generate our chatbot’s responses. We will use OpenAI chat completions API to summarise the visualization descriptions. We will also keep track of the top 5 visualizations with their Tableau embed code to display in the chatbot later.
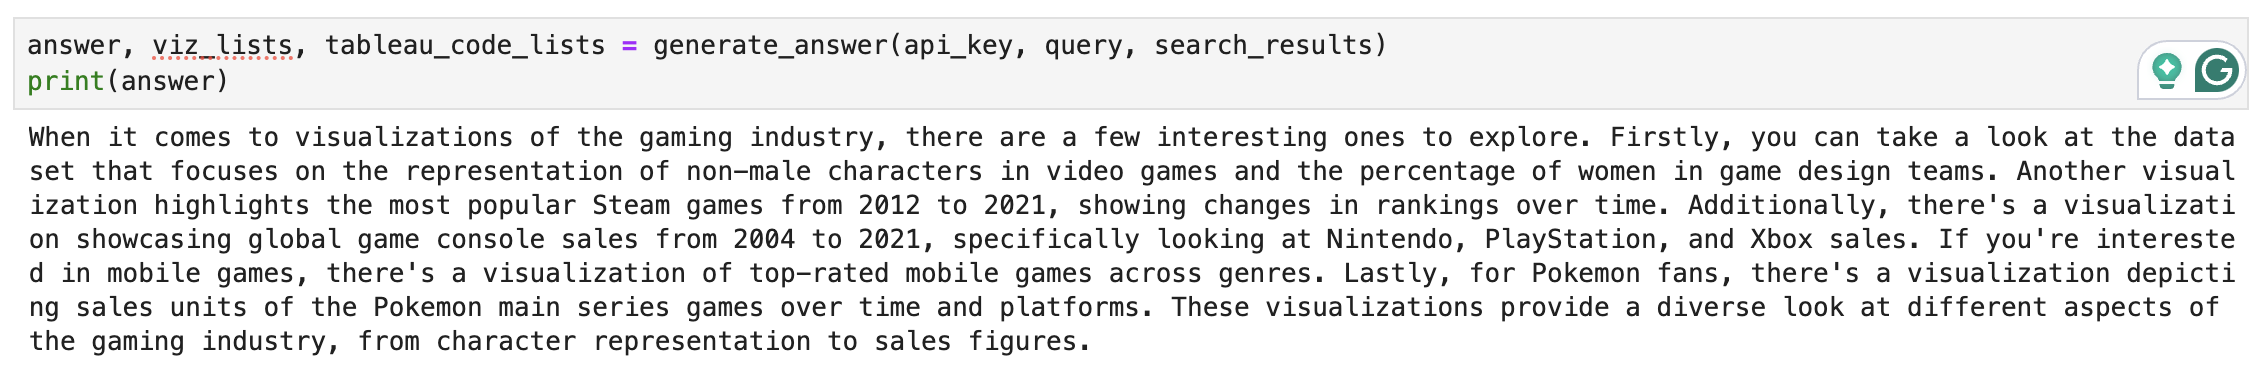
def generate_answer(api_key, query, search_results):
    '''
    Generate chatbot response summarizing relevant visualization
    with their descriptions and Tableau embed code.
    '''

    # filter the retrieved visualizations to keep those with distance <=1.5 only
    search_results = search_results[search_results['distance']<=1.5]
    # concatenate the description of the visualizations
    viz_info = search_results['description'].str.cat(sep='.\n')

    system_prompt = '''
    ### Context
    I have a list of visualizations I have made.
    You are a chatbot to help users to find interesting visualizations.

    ### Objective
    You will be provided with the user's question and a list of visualizations that are relevant.
    Your goal is to summarise the information of relevant visualizations to answer the question.

    ### Tone
    Answer the question in a friendly tone.

    ### Response
    Please answer in a paragraph with high-level summary of the relevant visualizations.
    '''

    retrieved_results = f'''
    ### User question
    {query}

    ### Relevant visualization info
    {viz_info}
    '''

    # call OpenAI API to get visualization summary
    openai.api_key = api_key
    messages = [{"role": "system", "content": system_prompt}, {"role":"user", "content": retrieved_results}]

    response = openai.chat.completions.create(
        model = 'gpt-3.5-turbo',
        messages = messages
    )

    answer = response.choices[0].message.content

    # get the list of top 5 visualizations and their tableau embed code
    viz_lists = []
    tableau_code_lists = []

    i = 1
    for index, row in search_results.iterrows():
        title = row["title"]
        url = row["url"]
        date = row["date"]
        tableau_code = row["tableau_code"]
        dist = row["distance"]
        if i > 5:
            break
        viz_lists.append(f"\n\n {i}. [{title}]({url}) on {date}")
        tableau_code_lists.append(tableau_code)
        i += 1

    return answer, viz_lists, tableau_code_lists
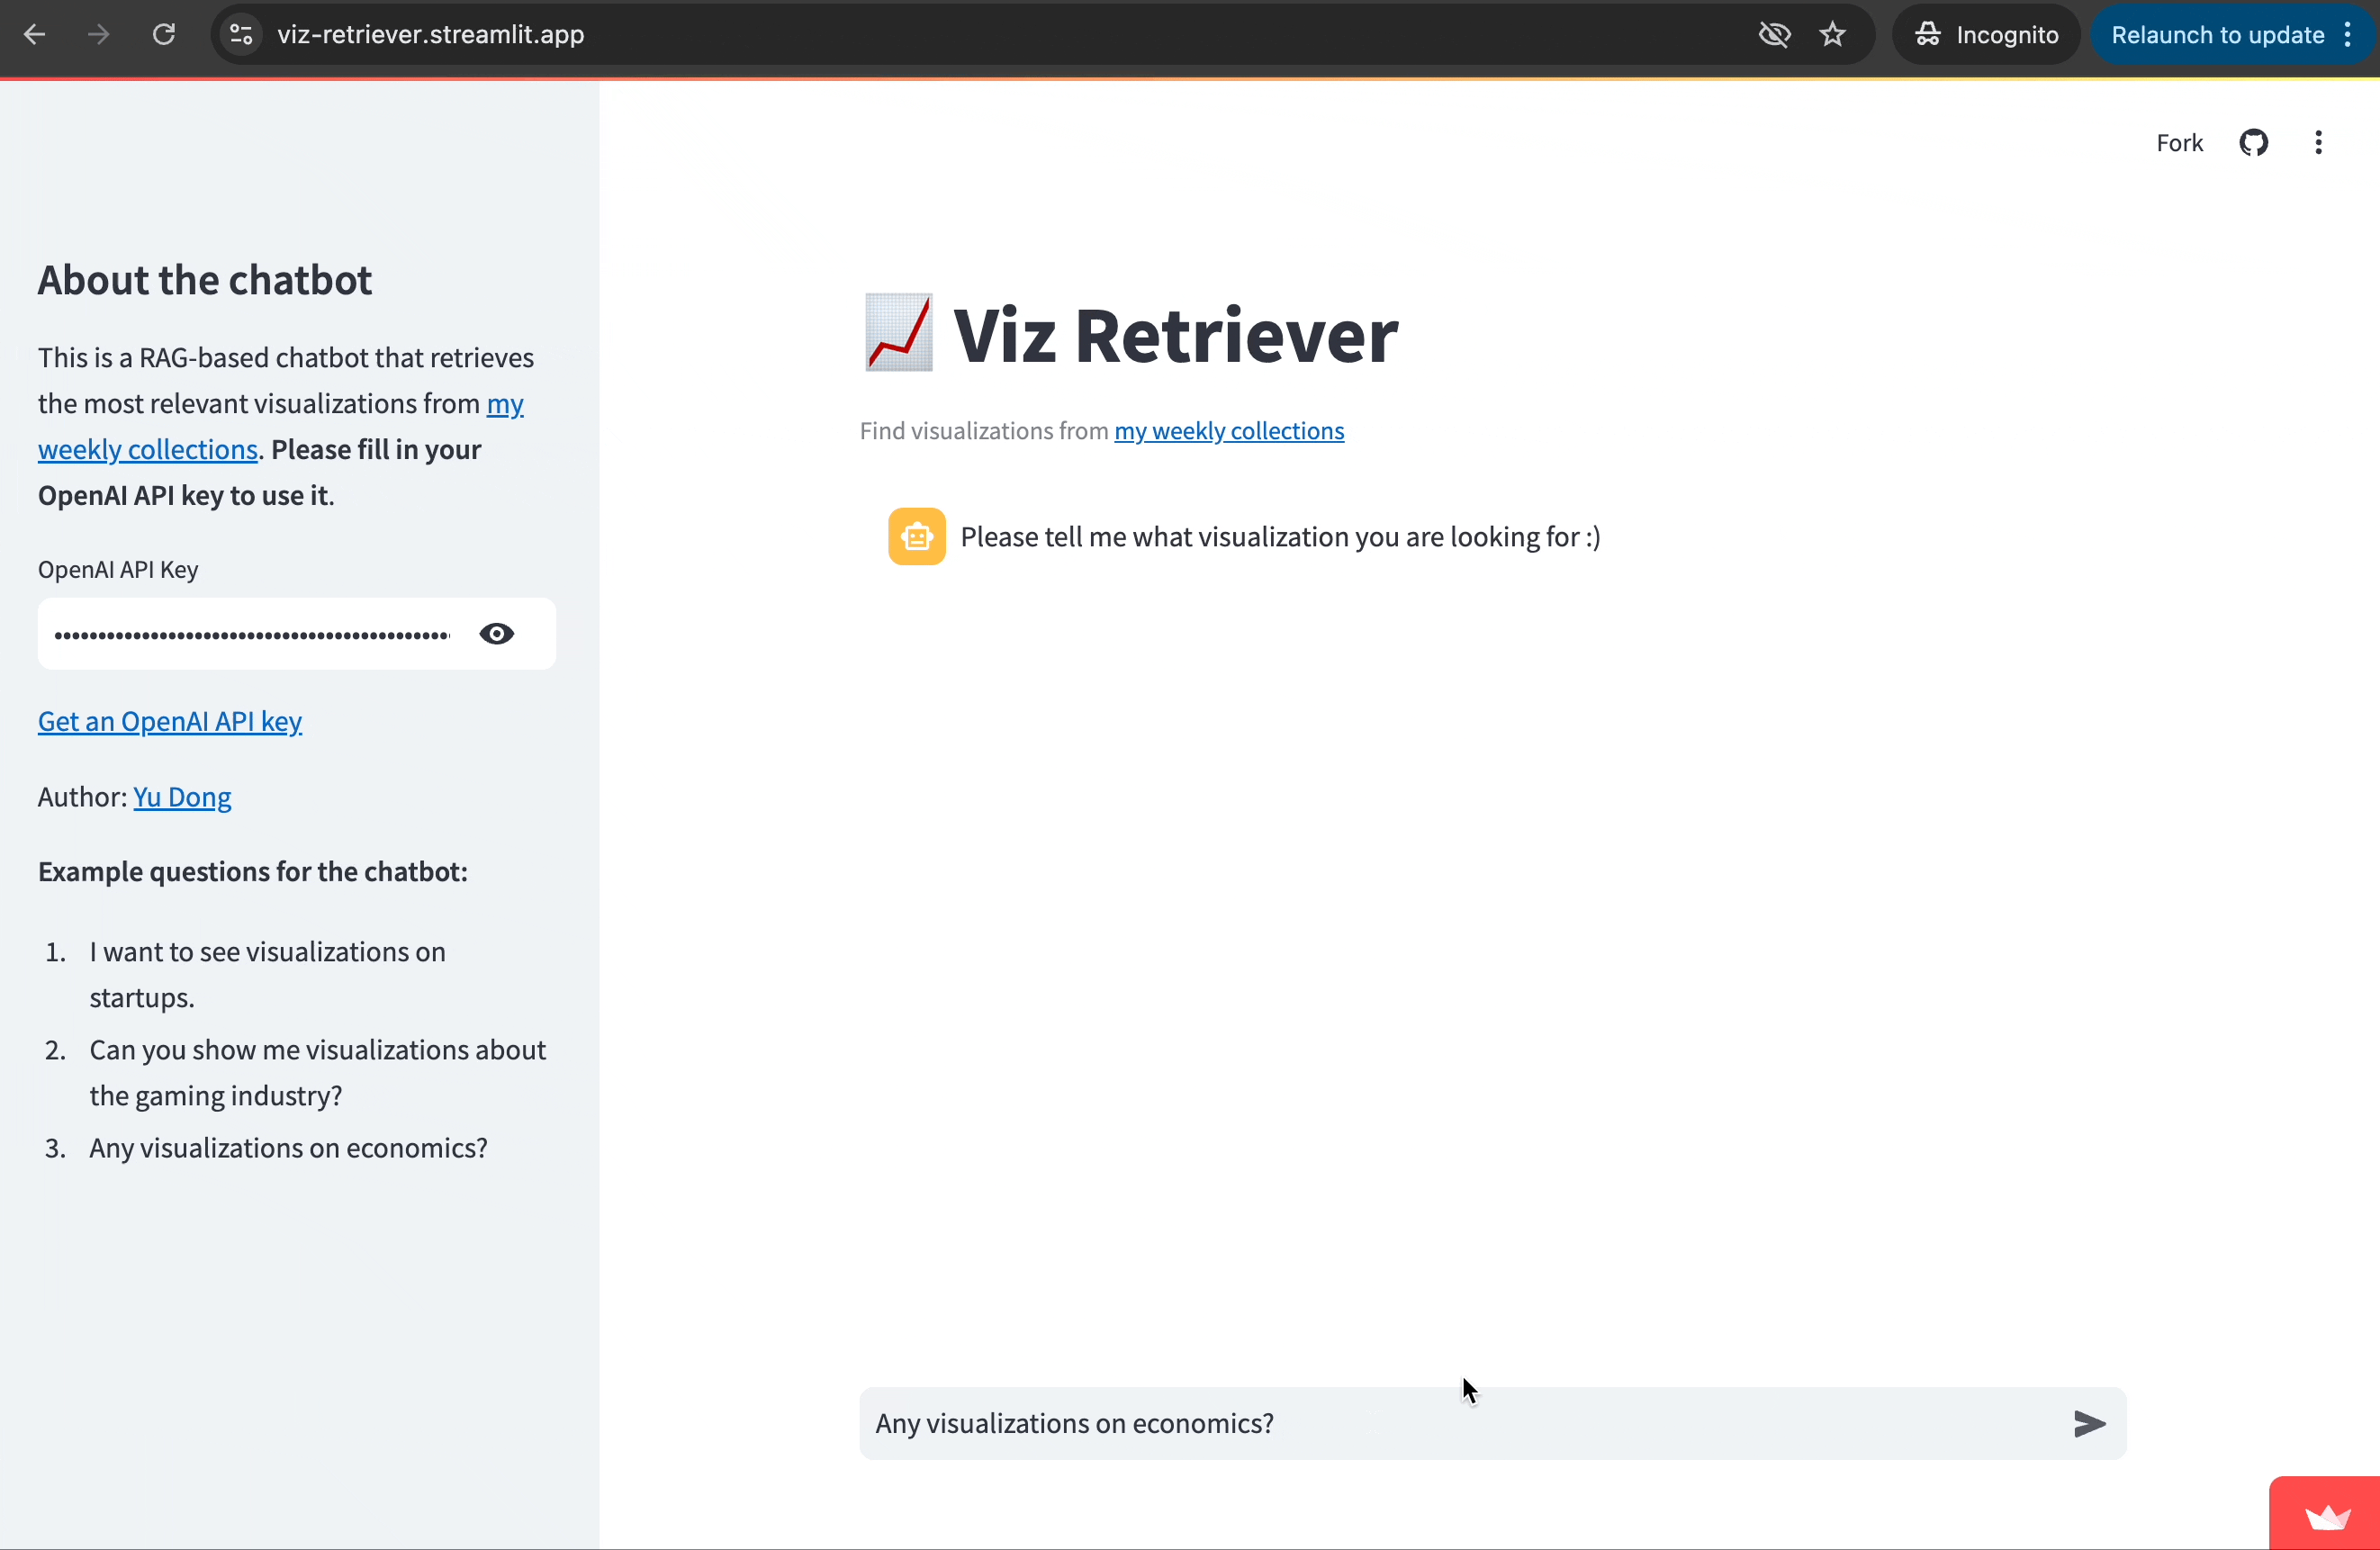
Bonus Step - Create a Streamlit App
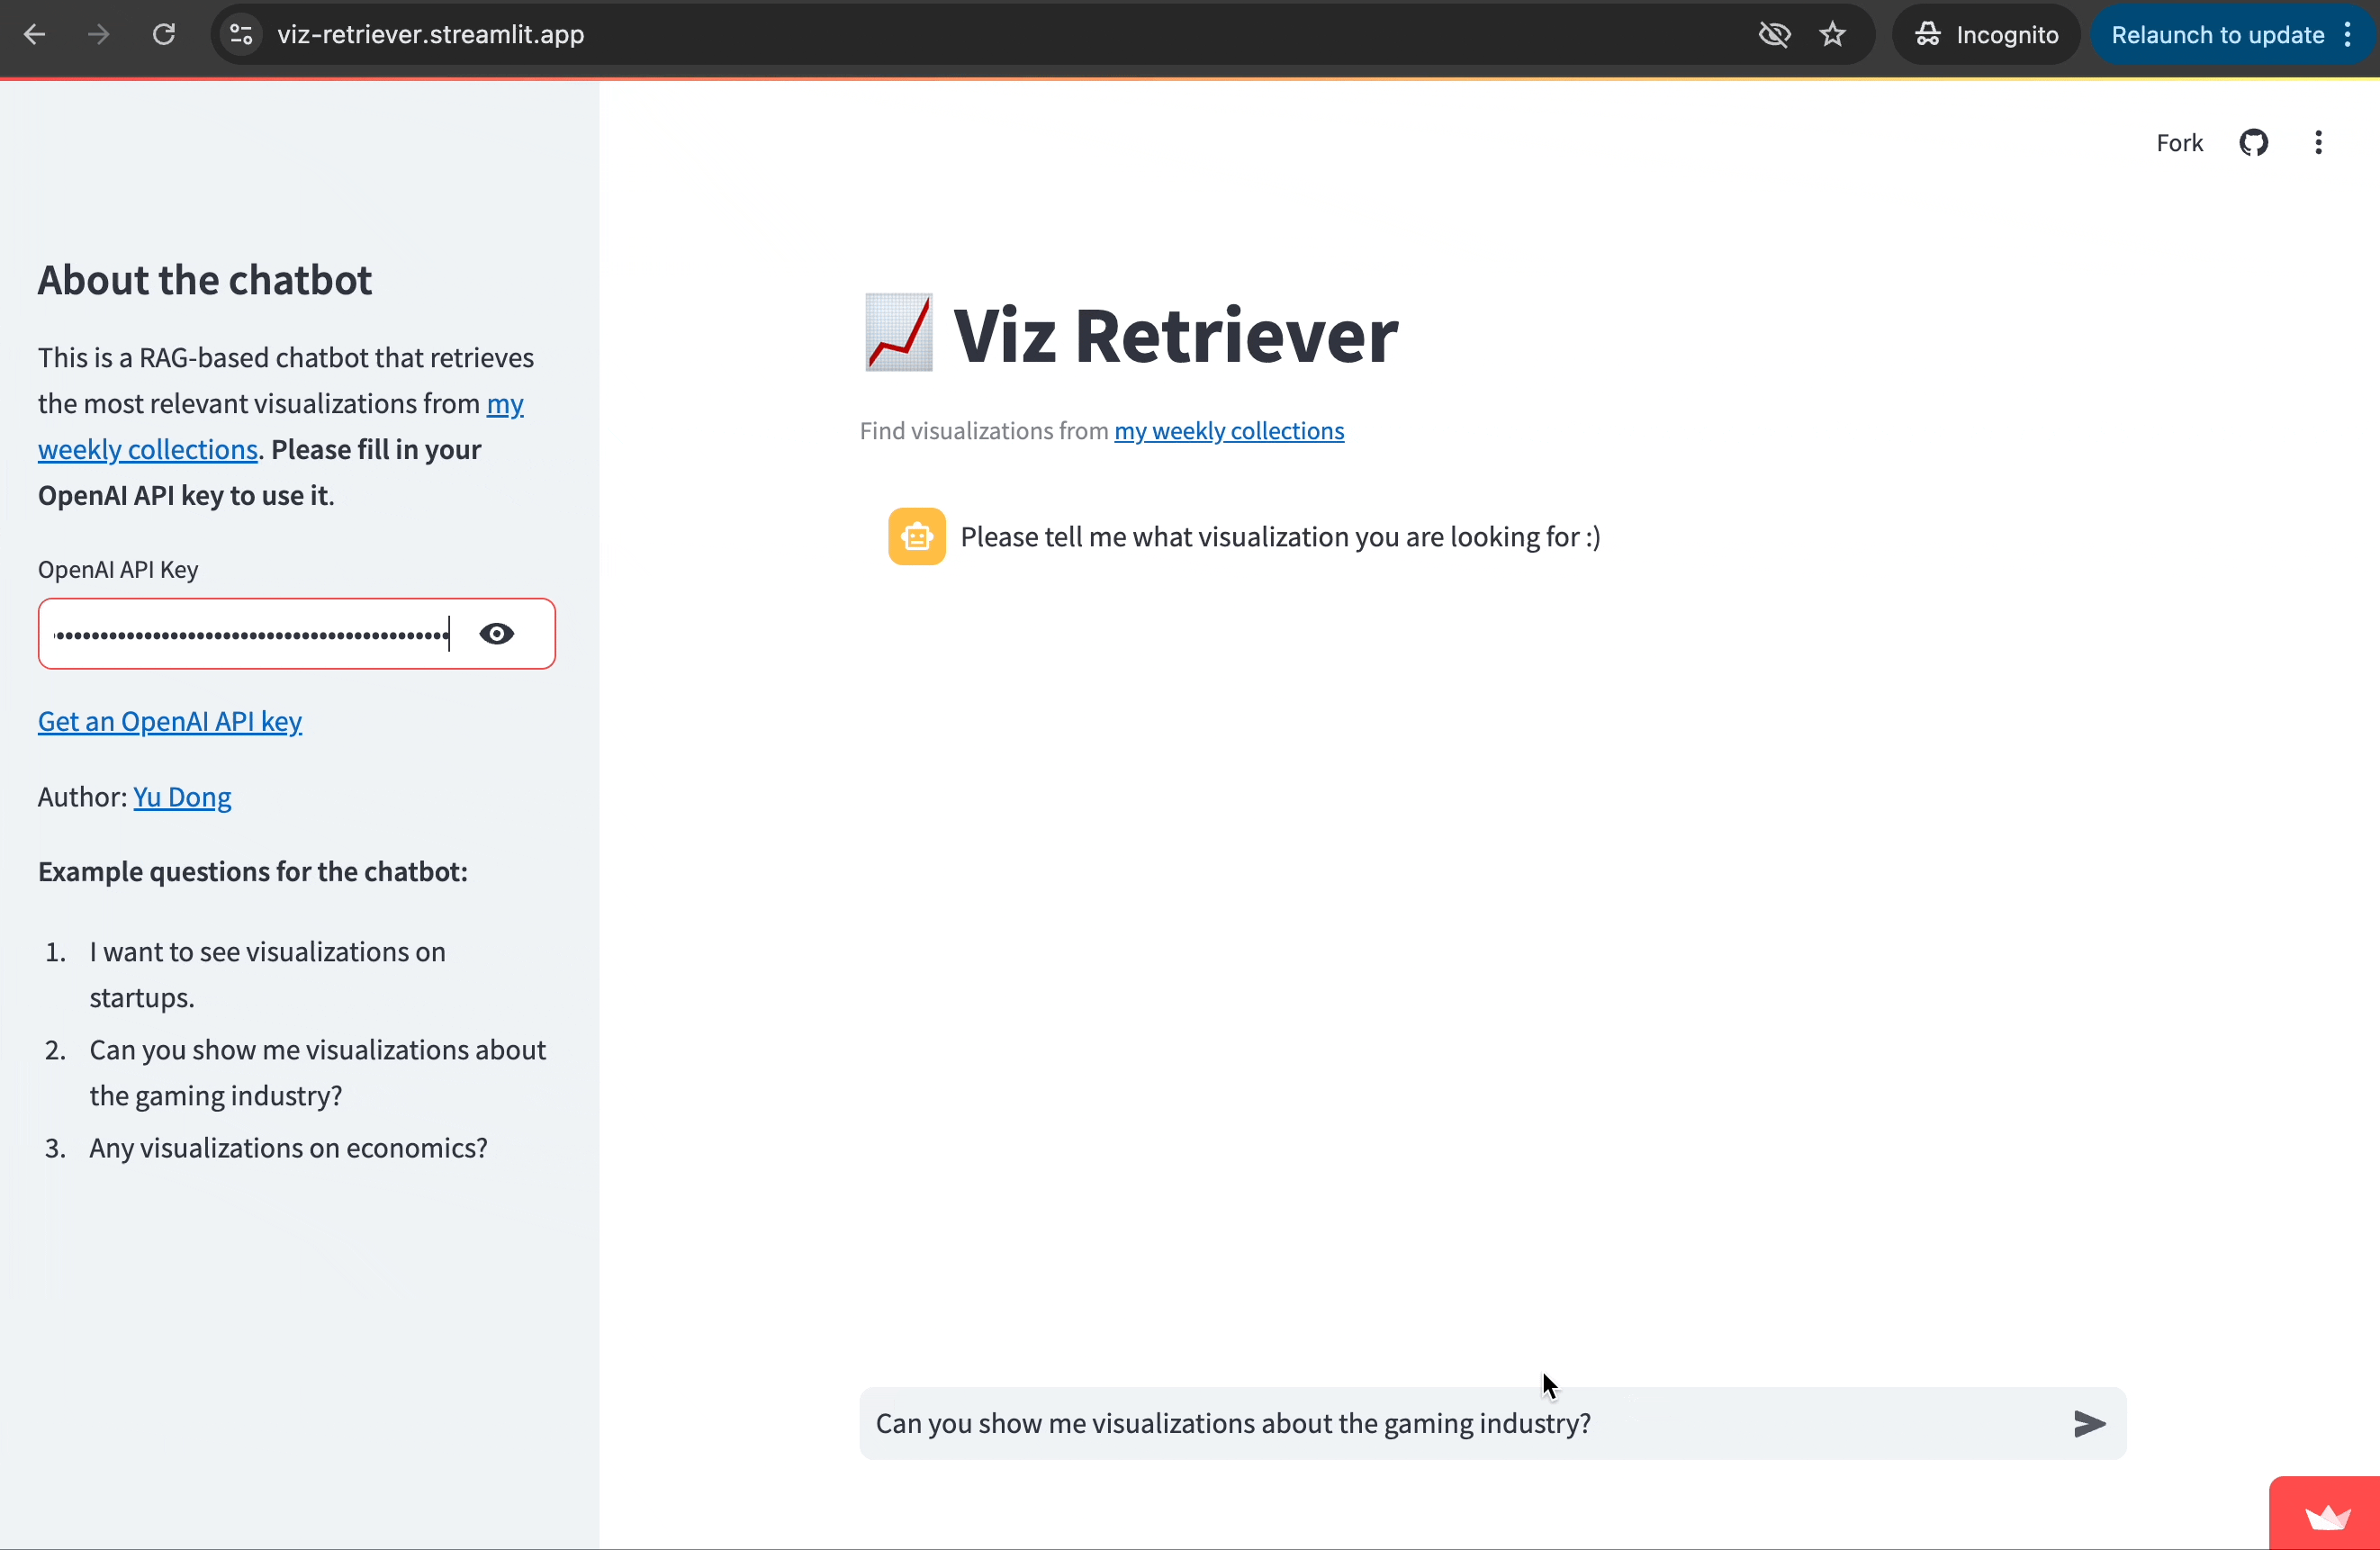
Woohoo! We’ve got a working script! You can test the chatbot in Jupyter Notebook as I did above, but let’s be honest - it would be way cooler to have a sleek UI, right? That’s where Streamlit comes in.
Streamlit is an open-source Python framework that makes it easy to create and share custom web apps for data science and machine learning projects. With just a few lines of code, you can turn your data scripts into interactive and user-friendly applications. So it is perfect for my use case here.
In the last step, we generated a visualization summary, along with a list of the most relevant visualizations and their Tableau embed codes. Let’s display them in our Streamlit app.
## create sidebar with chatbot introduction
with st.sidebar:
    st.sidebar.title("About the chatbot")
    st.sidebar.write("This is a RAG-based chatbot that retrieves the most relevant visualizations from [my weekly collections](https://yudong-94.github.io/personal-website/categories/#data-viz). Please fill in your OpenAI API key to use it.")
    ## get OpenAI API Key input
    openai_api_key = st.text_input("OpenAI API Key", key="chatbot_api_key", type="password")
    "[Get an OpenAI API key](https://platform.openai.com/account/api-keys)"
    st.sidebar.write("Author: [Yu Dong](https://github.com/yudong-94)")

## set up chatbot title
st.title("📈 Viz Retriever")
st.caption("Find visualizations from [my weekly collections](https://yudong-94.github.io/personal-website/categories/#data-viz)")

## set up chatbot message flow
if "messages" not in st.session_state:
    st.session_state["messages"] = [{"role": "assistant", "content": "Please tell me what visualization you are looking for"}]

for msg in st.session_state.messages:
    st.chat_message(msg["role"]).write(msg["content"])

## get user query
if prompt := st.chat_input():
    st.session_state.messages.append({"role": "user", "content": prompt})
    st.chat_message("user").write(prompt)

    ## retrieve search results based on the user query
    search_results = semantic_search(openai_api_key, prompt, 10)
    answer, viz_lists, tableau_code_lists = generate_answer(openai_api_key, prompt, search_results)
    ## send the chatbot response
    st.session_state.messages.append({"role": "assistant", "content": answer})
    st.chat_message("assistant").write(answer)
    ## display visualizations
    for i in range(len(viz_lists)):
        st.chat_message("assistant").write(viz_lists[i])
        st.components.v1.html(tableau_code_lists[i], height=600, width = 800)
Chatbot Demo
Everything is ready now 🎉! Let’s see how well our chatbot performs. Below, I’ve recorded more demos where the chatbot retrieves visualizations related to “startups” and “economics” based on user queries.
You can find all the code here and the app published on the Streamlit community. Feel free to try it out and share your thoughts below!

Next Steps
Of course, this is a very basic implementation of a RAG-based chatbot, but I hope it shows you the power of RAG and inspires you with your own chatbot use cases.
Additionally, for a production-level RAG application, there are many considerations and enhancements you should explore. For example:
- Vector Database: You might want to use a specialized vector database to handle embeddings at scale more efficiently. I simply used a Pandas DataFrame + FAISS given the small data size.
- Text Chunking: As I mentioned earlier if you are retrieving information from large documents, implementing and optimizing text chunking techniques would improve RAG performance.
- Query Pre-processing: You can optimize the retrieval step by pre-processing the query. This involves techniques like query translation, query expansion, etc.
- Evaluation: Set up a thorough evaluation process to fine-tune the retrieval and generation steps of your chatbot.
If you’re interested in diving deeper, I highly recommend checking out this article for more technical details and advanced techniques.

