
US Non-cash Payment Methods
US Non-cash Payment Methods
This week, I found the The Federal Reserve Payments Study on the Federal Reserve website. It offered valuable data on the distribution of non-cash payments in the US.
My Visualization
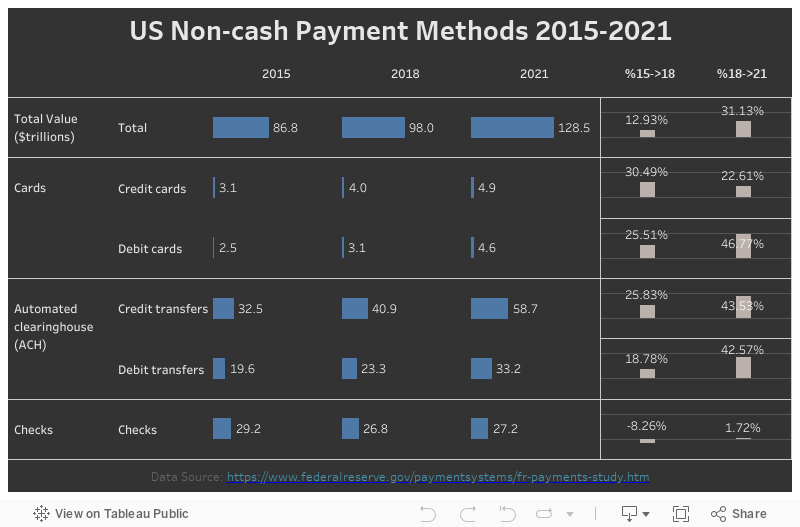
The visualization is a combination of two bar charts, one showing the total value of each payment method, another showing the % change.
Please notice that all the visualizations are designed for desktop view, so it is recommended to view them on a desktop device.
Insights
- Among all the noncash payment methods, cards (both credit cards and debit cards) have the minimum value, but the highest number;
- Looking at the total value trend over time, check has the lowest growth (actually its value even declined from 2015 to 2018), despite the overall noncash payment growing by 31% from 2018 to 2021.
Follow this link to find more weekly vizzes :)

