
Zillow Home Value Index 2000-2023
Zillow Home Value Index 2000-2023
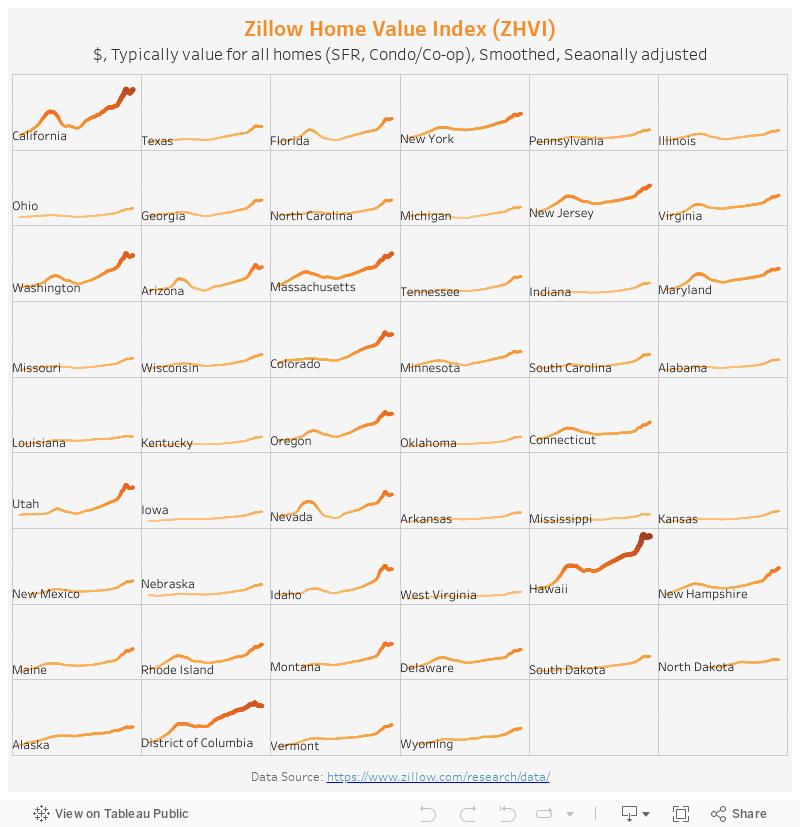
The dataset I am visualizing this week is the Zillow Home Value Index (ZHVI) for all homes (SFR, Condo/Co-op). It shows how the housing price has been trending between 2000 and 2023 in each state.
My Visualization
The visualization is a grid-view of the ZHVI time series for all the states. It is ordered by the housing sample size (left to right and top to bottom).
Please notice that all the visualizations are designed for desktop view, so it is recommended to view them on a desktop device.
Insights
- For most states, we see the same time series pattern where the home value went up from 2000 to 2007, then dropped during the economic crisis in 2008; The home value started to rise again since 2012, flatted a bit during covid, but soon on an upward trend again;
- The states with the highest home values as of 2023 end are Hawaii, California, D.C., Massachusetts, and Washington.
Follow this link to find more weekly vizzes :)
