
Visitor Arrivals to Japan Yearly 1964-2023
Visitor Arrivals to Japan Yearly 1964-2023
I am posting my visualization this week as I will be in Japan next Monday! So the visualization topic is again about foreign visitors to Japan from the Japan Tourism Statistics Website.
My Visualization
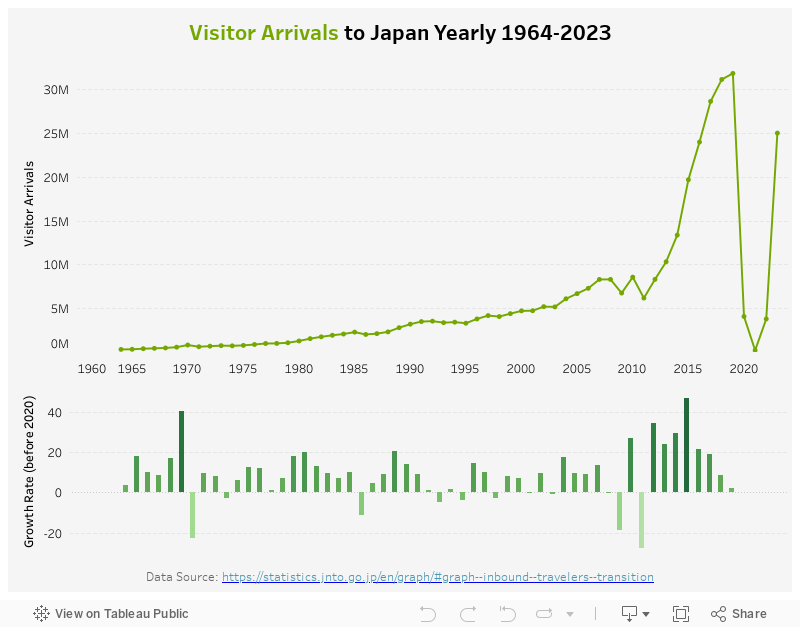
The visualization has two components – on the top is a line chart with the # of annual visitors, and on the bottom is a bar chart showing the YoY growth rate (prior to the pandemic to remove outliers).
Please notice that all the visualizations are designed for desktop view, so it is recommended to view them on a desktop device.
Insights
- Foreign visitors to Japan grew steadily year over year from 1964 to 2008 and saw some fluctuations between 2008 and 2012, probably due to the financial crisis;
- However, after 2012, foreign visitors increased significantly year over year, with the highest growth rate of 47% in 2015;
- Not surprisingly, we saw a dip during the pandemic, but visitor numbers bounced back quickly in 2023.
Follow this link to find more weekly vizzes :)
