
Top-Rated Mobile Games
Top-Rated Mobile Games
The dataset I am visualizing is from Kaggle. It is a collection of top-rated mobile games across genres with their developers and ratings.
My Visualization
I felt a scatter plot could be a good candidate here, but then I realized there are so many duplicate ratings, making the dots overlapping each other. However, jitter plot is here to rescue! This is probably my 1st time trying to do a jitter plot in Tableau, and I did it using the random() function to spread out the dots on the x-axis.
Please notice that all the visualizations are designed for desktop view, so it is recommended to view them on a desktop device.
Insights
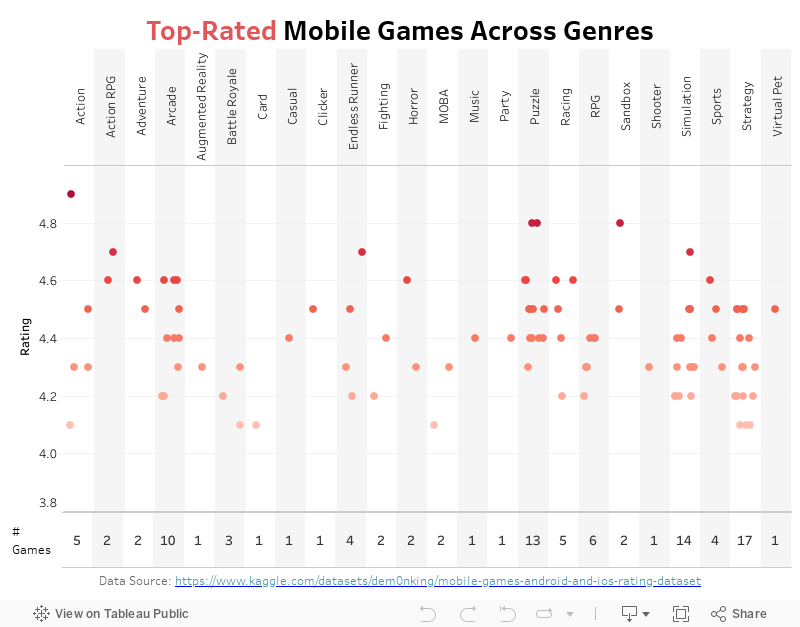
- Though I am not sure about the criteria of the games included in the dataset, it seems like we have the highest # of high-rating mobile games in genres like strategy, simulation, and puzzle;
- There are four games with ratings above 4.8: Hades (Action), Monument Valley (Puzzle), The Room (Puzzle), and Minecraft (Sandbox).
Follow this link to find more weekly vizzes :)
