
Desktop vs. Mobile vs. Tablet Market Share 2010 - 2023
Desktop vs. Mobile vs. Tablet Market Share 2010 - 2023
The dataset I am visualizing this week comes from statcounter – It is a free online visitor stats tool, providing stats on various web data from over 1.5 million sites that had installed their tracking code. I found it by searching for device market share data, and ended up becoming interested in the platform (desktop, mobile, tablet etc.) market share trend, especially the difference between regions.
My Visualization
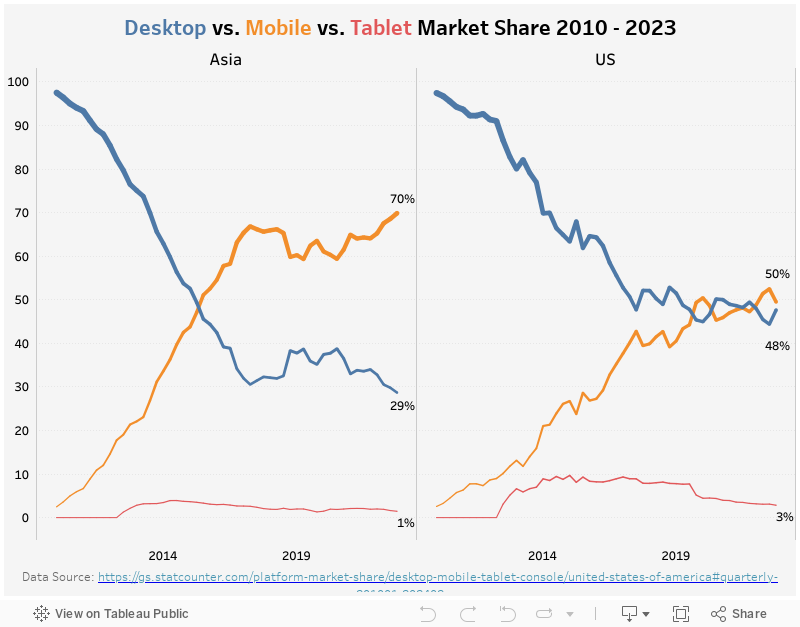
The visualization is a two-tile line chart, putting the platform market share trend of Asia and US side by side for easier comparison. I also used the color coding in chart title as the legend.
Please notice that all the visualizations are designed for desktop view, so it is recommended to view them on a desktop device.
Insights
- In both regions, we see a similar pattern – desktop market was the dominant web service provider at the beginning of 2010, but its place is gradually taking over by mobile devices in the last 10 years;
- However, the timing and degree of this takeover is different – In Asia, the market share of mobile grew linearly from 2010 to 2017, and surpassed desktop in 2015, likely because in many parts of Asia, internet was made accessible to them later than the US. When the mobile devices became cheaper, they soon became the easiest way for many people there to get access to the internet.
- Meanwhile, in the US, until today, we see a similar market share between desktop and mobile platforms.
Follow this link to find more weekly vizzes :)
