
%People Working at Home by Education Level
%People Working at Home by Education Level
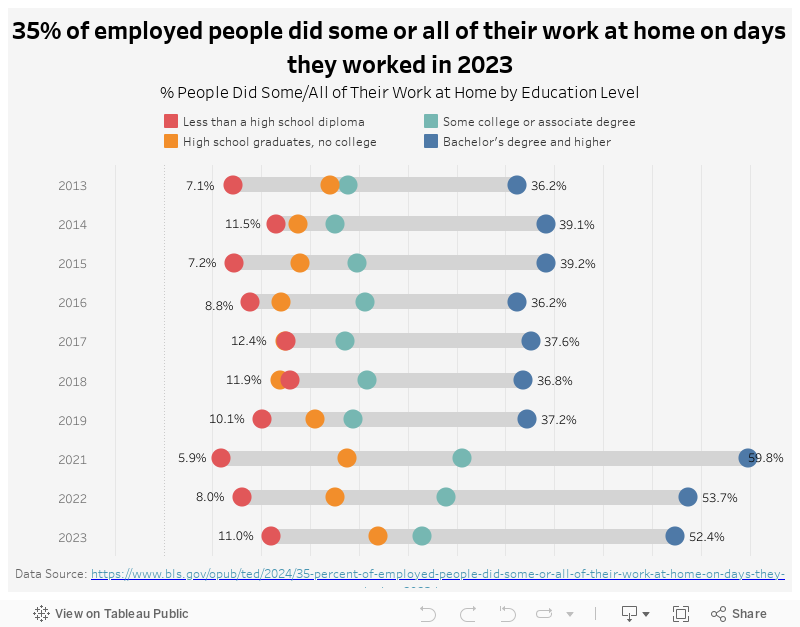
This week, I came across this new publication from the Bureau of Labor Statistics stating “35 percent of employed people did some or all of their work at home on days they worked in 2023”. Remote working became a trend during the pendamic, but recently we have seen more and more companies announcing RTO (Return-to-office) partially or completely. This report shows us exactly this trend, with breakdown of gender and education level.
My Visualization
This visualization combines gantt plot and scatter plot to show the trend over time and highlight the differences across the education levels.
Please notice that all the visualizations are designed for desktop view, so it is recommended to view them on a desktop device.
Insights
- Though the data in 2020 is not available due to the pendamic, we can clearly see in 2021, there are way more people did some or all of their work at home. Especially for people with bachelor’s degree and higher, the % is almost 60%;
- From 2021 to 2023, this percentage decreased for people with some college or higher degrees, but higher for people with lower degrees;
- Generally speaking, people with higher education levels are more likely to do some or all of their work at home, probably becuase their work is more likely to be the type of work that can be done remotely.
Follow this link to find more weekly vizzes :)
