
Per Second - Vibrations / cycles / waves / rate
Per Second - Vibrations / cycles / waves / rate
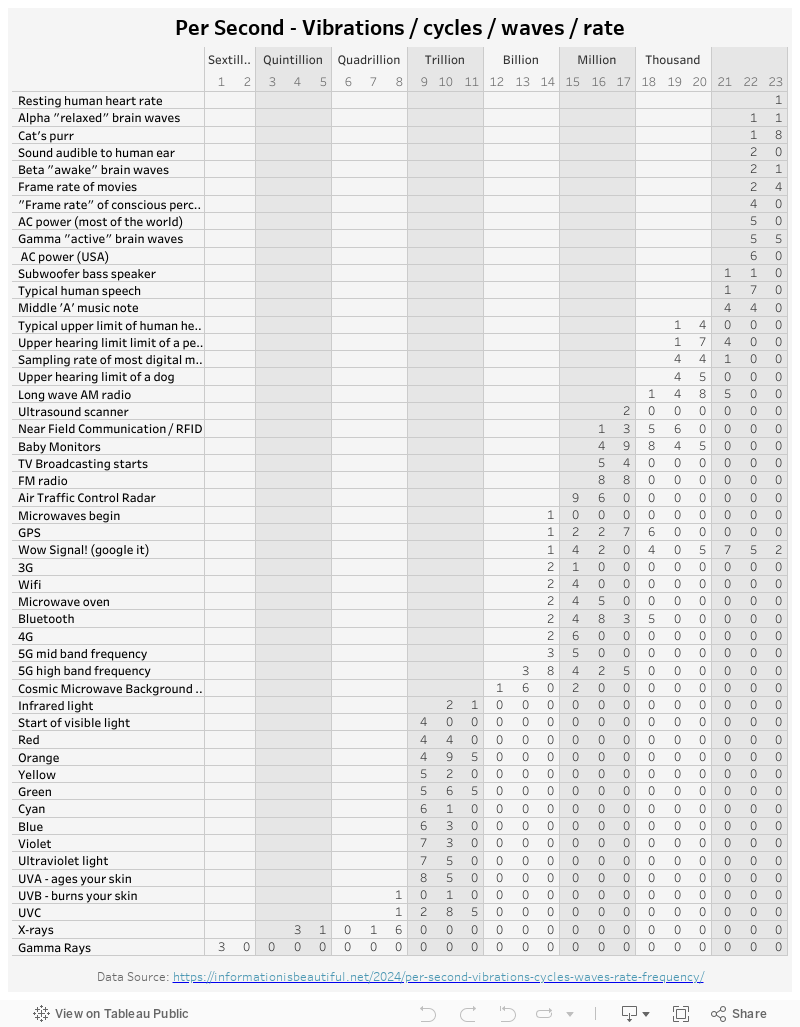
This week, I found this fun visualization on Information is Beatiful – it shows the vibrations/cycles/waves/rate per second of various metrics. It is not a traditional visualization, as it is basically listing the numbers ascendingly. Therefore, it feels very refreshing to me as I have made quite a few line charts lately :)
My Visualization
To make this visualization, I extracted the number at each digit and creating a table view to mimic the original visualization. It is like a transformed logarithmic scale visualization.
Please notice that all the visualizations are designed for desktop view, so it is recommended to view them on a desktop device.
Insights
- We see extreme differences in frequency scales for the metrics listed. Human-related metrics like resting human heart rate and brain waves are below 100 per second; Common technology frequenies (radio, Wifi, 5G, etcs) are found in millions and billions of Hz; Meanwhile, color waves and natural rays have much higher frequencies.
Follow this link to find more weekly vizzes :)
