
Daylight Saving vs. Standard Time
Daylight Saving vs. Standard Time
Daylight Saving started yesterday, and everyone in the US ‘lost’ one hour. I am tired of this twice a year time switches and I know this is a hot debate topic in US society. Therefore, this week, I am visualzing the survey result by YouGov regarding people’s preferences on daylight saving.
My Visualization
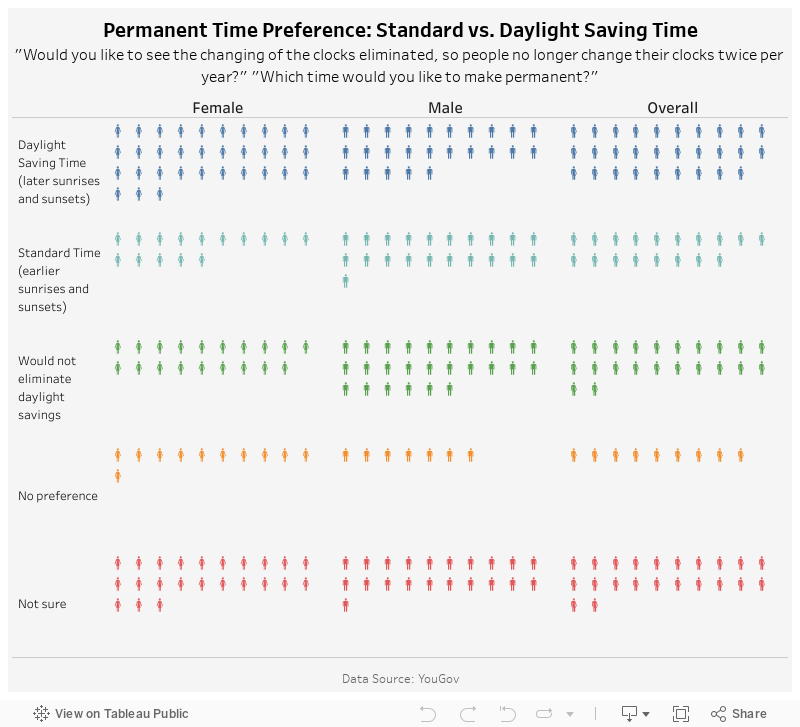
In this chart, I plotted each 1% of respondent as one “human” and use that to represent how popular each option is among its group.
Please notice that all the visualizations are designed for desktop view, so it is recommended to view them on a desktop device.
Insights
- Overall, 22% people voted for “would not eliminate daylight savings” when asked “would you like to see the changing of the clocks eliminated, so people no longer change their clocks twice per year?”. The percentage is higher among male (21% male vs. 15% female), but it’s the unpopular opinion in both groups.
- For the follow up question of “which time would you like to make permanent”, more people preferred Daylight Saving Time than Standard Time in both gender groups. However, we see a clear diferences again – there are more female respondents prefer Daylight Savings (33% of female respondents) than male (25% of male respondents).
Follow this link to find more weekly vizzes :)

