
LLM Evolution
LLM Evolution
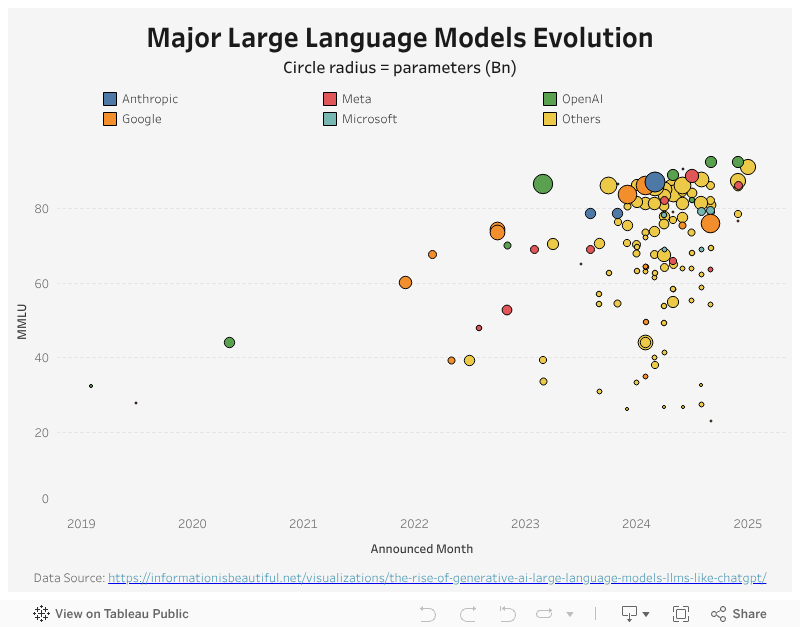
My work this week is inspired by a visualization from Information is beautiful. It plots the LLM models from 2022 to late 2024 in a scatter plot, showing the fast evolution of LLM in the past 3 years.
My Visualization
My visualization is also a scatter plot, but a more simplified version – Same as the original viz, I plot the LLM models on announce time x MMLU axes, with the color indicating the creators and the size of the circles indicating the number of parameters. Meanwhile, the original viz also used different shapes to represent if the model has open access or not.
Please notice that all the visualizations are designed for desktop view, so it is recommended to view them on a desktop device.
Insights
- We see a rapid LLM performance improvement post-2023, with lots of models scoring above 70 MMLU and even approaching or exceeding 80;
- OpenAI, Google, Anthropic, and Meta are definitely the biggest players in this field, but there are many emerging new competitors with great performance, for example, DeepSeek;
- Model size (parameter size) does not always translate to model performance, as there are some smaller models achieving great MMLU scores as well.
Follow this link to find more weekly vizzes :)
