
US Government Telework Rate
US Government Telework Rate
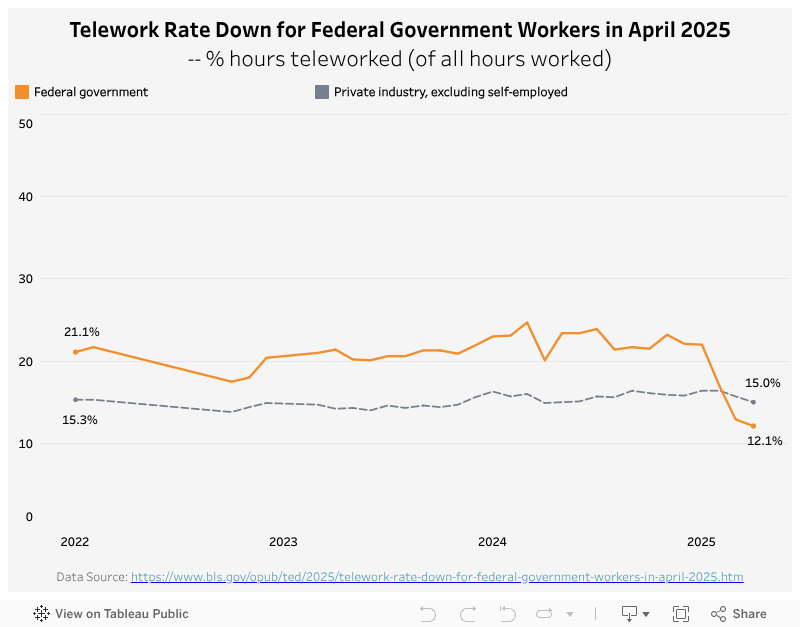
The dataset I am visualizing this week is published on The Economics Daily by the U.S. Bureau of Labor Statistics. It shows an interesting trend of how the telework rate in the U.S. federal government went down in April 2025.
My Visualization
The visualization is a simple line chart – the orange solid line is the telework hour rate in the US federal government, while the dotted line is the telework hour rate in the private industry, serving as an reference.
Please notice that all the visualizations are designed for desktop view, so it is recommended to view them on a desktop device.
Insights
- In the past three years, the telework hour rate in the U.S. federal government has always been higher than that in the private industry by ~5%.
- However, the trend flipped in early 2025, as the government worker telework hour rate dropped from 22% in Jan 2025 to 12% in April 2025, likely related to the latest government worker requirement changes, as we don’t see a similar trend in the private industry.
Follow this link to find more weekly vizzes :)
