
California Electricity Generation Fuel Mix
California Electricity Generation Fuel Mix
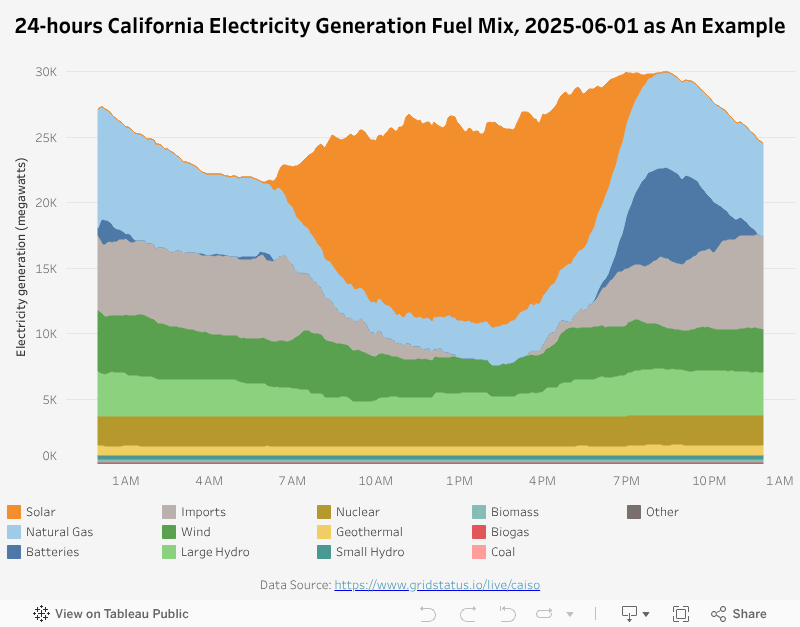
California has entered the no-rain summer season. Great sunshine with long daytime hours means plenty of solar energy. This week, I am visualizing the California Electricity generation fuel mix by CAISO (California Independent System Operator). The data is downloaded from GridStatus.io. Due to the data availability, I only visualized the day of June 1st as an example.
My Visualization
This visualization is a stacked area chart with each color representing one type of energy source.
Please notice that all the visualizations are designed for desktop view, so it is recommended to view them on a desktop device.
Insights
- California electricity supply is highly dynamic, shifting its fuel mix based on time of day;
- Electricity generated from solar energy gradually increases from around 6:30am and reaches its peak at around 2:30pm and accounts for 50%+ of the total electricity supply; then it decreases to 0 at around 8pm;
- Natural gas, batteries, and imports fill in the energy gap, especially during early morning and nighttime;
- Meanwhile, electricity generated from nuclear and geothermal are relatively flat throught the day and accounts for ~10% of the total supply.
Follow this link to find more weekly vizzes :)

