
California Wildfire 1987-2023
California Wildfire 1987-2023
I saw on the news last week that the smoke from wildfire in Canada significantly impacted air quality in Central and Southern Europe. Clearly, wildfire is a disaster that not only influences local residents but have global impacts. We’ve also had several pretty bad wildfires these years in California, for example, the very heartbroken one in LA earlier this year. Therefore, my visualization this week focuses on the number of wildfires and acres burned since 1980s.
My Visualization
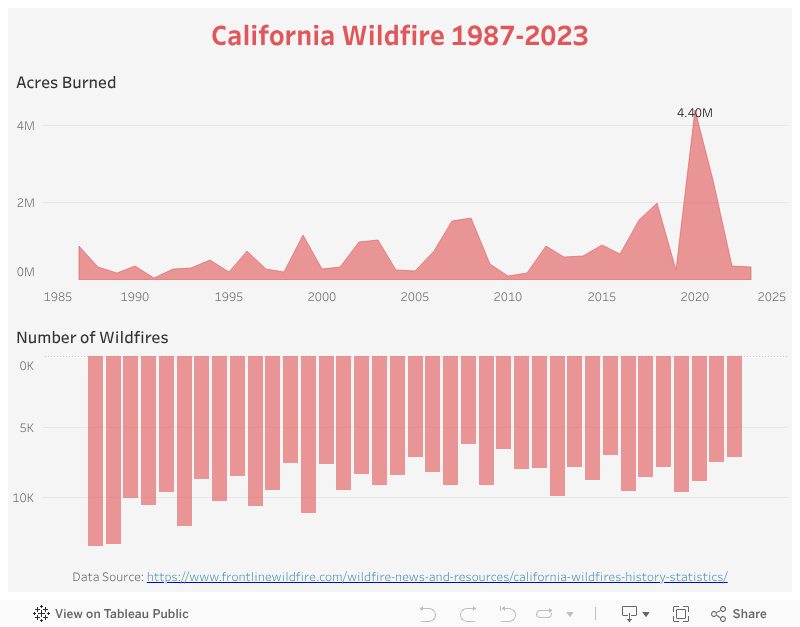
This visualization has two parts – on the top, it shows the # acres burned; on the bottom, it shows the # of wildfires every year.
Please notice that all the visualizations are designed for desktop view, so it is recommended to view them on a desktop device.
Insights
- The total acres burned fluctuates year over year – there are usually two to three better years followed by a large spike. We saw the largest spike in 2020, with the August Complex wildfire in northwestern California burned over 1.03m acres – the largest wildfire in California history.
- The Meanwhile, the number of wildfires remains relatively stable since 2000 (actually slightly down from 1980s). This implies a shift from many small fires to fewer but more severe ones in those recent spike years.
Follow this link to find more weekly vizzes :)
