
Travel Time Index
Travel Time Index
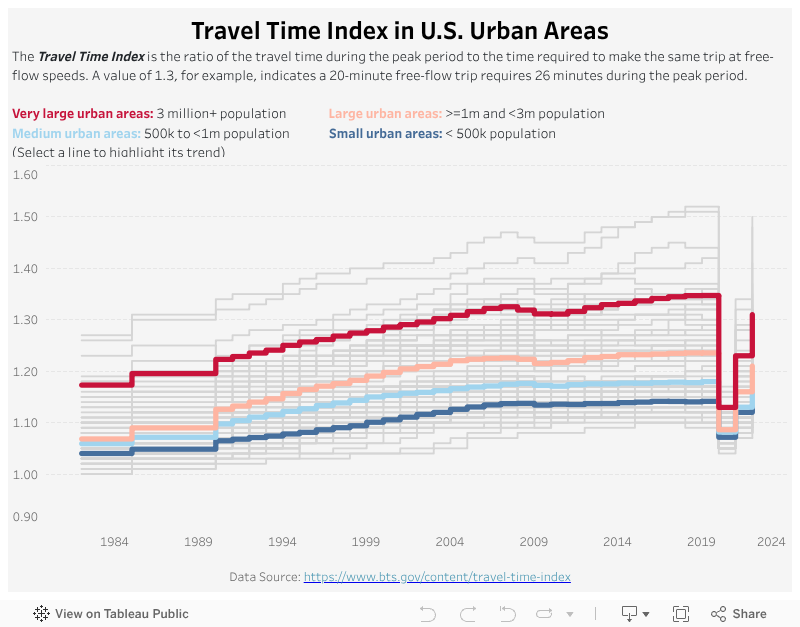
The Travel Time Index is a metric published by the Bureau of Transportation Statistics. It is the ratio of the travel time during the peak period to the time required to make the same trip at free-flow speeds. A value of 1.3, for example, indicates a 20-minute free-flow trip requires 26 minutes during the peak period. This week, I am visualizing the trend of Travel Time Index in major US urban areas.
My Visualization
This visualization is a line chart – there are four highlighted lines, representing the average travel time index of very large/large/medium/small urban areas. The other lines are the US urban areas.
Please notice that all the visualizations are designed for desktop view, so it is recommended to view them on a desktop device.
Insights
- From 1982 to 2019, the Travel Time Index has consistently increased across all urban area sizes, indicating worsening traffic congestion over the decades;
- The Travel Time Index shows a positive correlation with the size of the urban areas – the Travel Time Index of a very large urban area reached 1.35 in 2020, while the Travel Time Index of small urban area is only 1.07 in 2020;
- There is a sharp drop in Travel Time Index around 2020 across all city sizes due to the pandemic lockdowns, but it bounced back quickly after 2022.
Follow this link to find more weekly vizzes :)

