
US Avg Retirement Age
US Avg Retirement Age
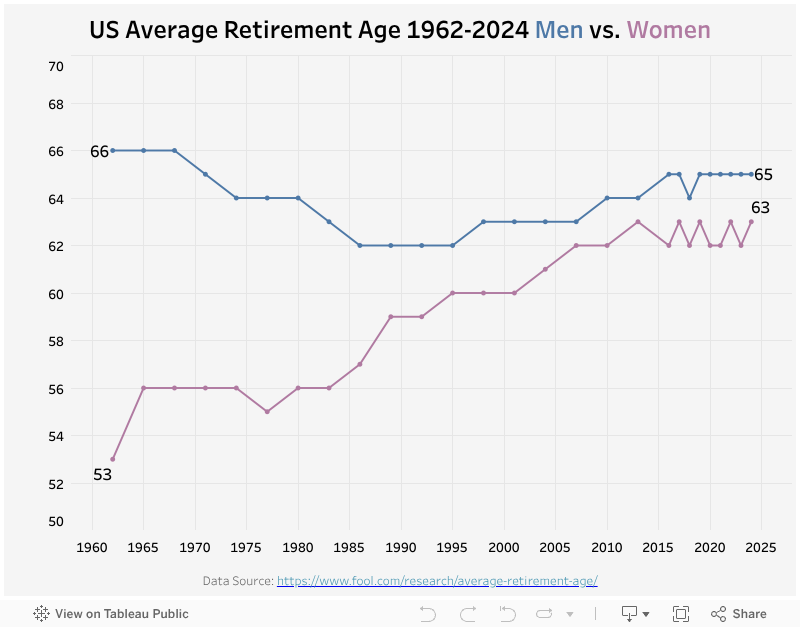
This week, my visualization looks at the US average retirement age trend from 1960s, by men and women. I found the original data on The Motley Fool.
My Visualization
This visualization is a simple time series line chart with two colors representing men and women. Instead of a classic color legend, I indicated the colors in the title.
Please note that all the visualizations are designed for desktop view, so it is recommended to view them on a desktop device.
Insights
- In 1962, men retired at 66 on average, while women retired at just 53 — a 13-year gap. However, by 2024, the gap has narrowed to just 2 years (Men: 65, Women: 63). This corresponds with the increased female labor force participation rate and policy and cultural shifts toward gender equity in work.
Follow this link to find more weekly vizzes :)

