
Avg Jobs by Ages
Avg Jobs by Ages
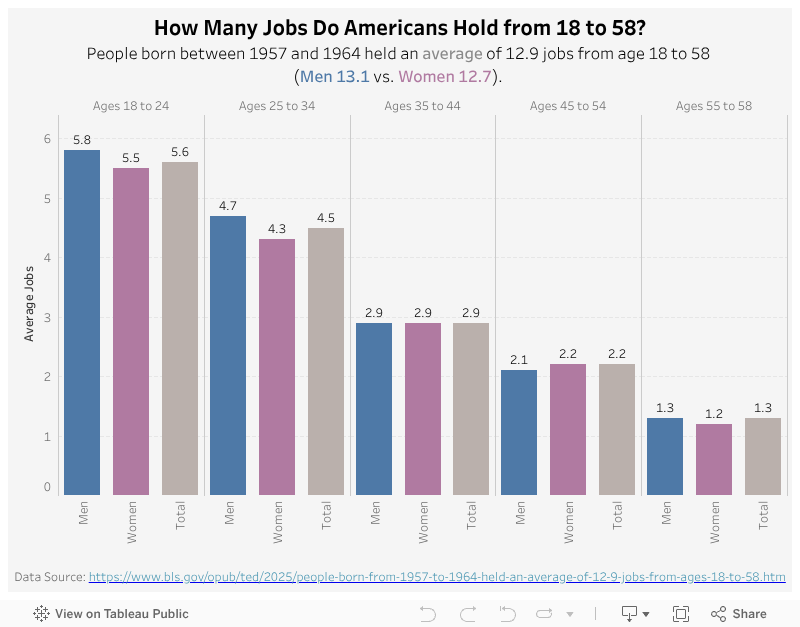
Have you ever wondered how many jobs Americans hold from 18 to 58, and during what time do they change jobs most often? My visualization this week is based on a report from U.S. Bureau of Labor Statistics, looking at jobs held by people born between 1957 and 1964.
My Visualization
This visualization is a bar chart grouped by age groups and gender.
Please note that all the visualizations are designed for desktop view, so it is recommended to view them on a desktop device.
Insights
- People born between 1957 and 1964 held an average of 12.9 jobs from ages 18 to 58. This number is slightly higher for men (13.1) vs. women (12.7);
- Ages 18 to 24 is when people change their job most frequently. On average, everyone held 5.6 jobs during these ages;
- With people getting older, they get less likely to change jobs.
Follow this link to find more weekly vizzes :)

