
Bitcoin 5-Year Daily Prices
Bitcoin 5-Year Daily Prices
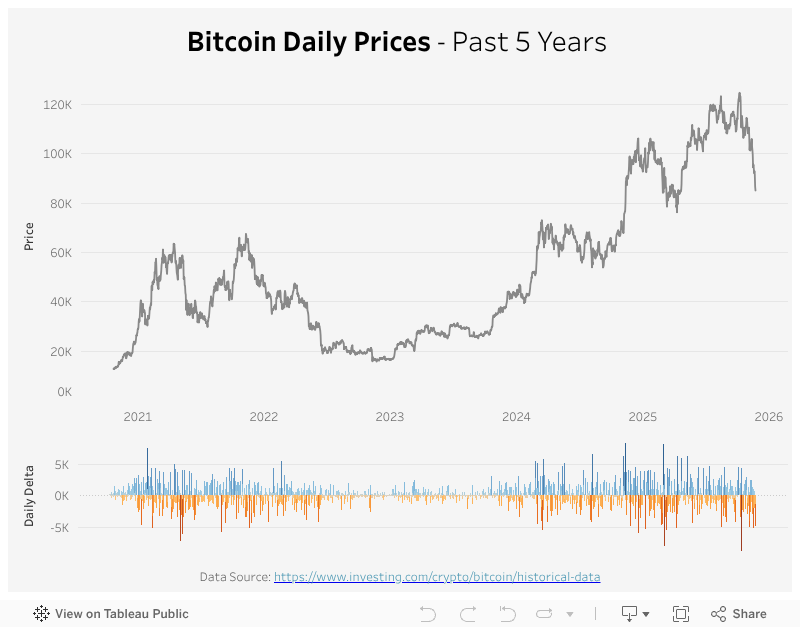
Bitcoin price went down from its peak of $124k on 10/6 to only $86k (-30%) today in just 45 days. This has caused some panic about crypto. However, this is not the first time we have seen such fluctuation in BTC prices. This week, I made a visualization of daily BTC prices in the past 5 years and we can see how often this happens.
My Visualization
This visualization has two parts – on the top, it shows the daily BTC prices in a line chart; on the bottom, it plots the daily price differences with a bar chart, colored based on the difference.
Please note that all the visualizations are designed for desktop view, so it is recommended to view them on a desktop device.
Insights
- Aside from the dip from mid 2022 to early 2024, we have seen five up and downs in BTC prices since 2021;
- BTC price decreased by $8.7k on 10/10, which is the largest single-day decrease we’ve seen in the past 5 years. The closest decrease was on 3/3 of $8.05k.
Follow this link to find more weekly vizzes :)

