How Many Hours Americans Need to Work to Pay Their Mortgage
How Many Hours Americans Need to Work to Pay Their Mortgage
About Makeover Monday
MakeoverMonday is a social data project: “Each week we post a link to a chart, and its data, and then you rework the chart. Maybe you retell the story more effectively, or find a new story in the data. We’re curious to see the different approaches you all take. Whether it’s a simple bar chart or an elaborate infographic, we encourage everyone of all skills to partake. Together we can have broader conversations about and with data.”
Starting from Jan 08, 2018, I decided to put aside one hour on Monday weekly to create some visualization and find some insights from the data.
The datasets are published each week at: MakeoverMonday Datasets.
Makeover Monday 1119
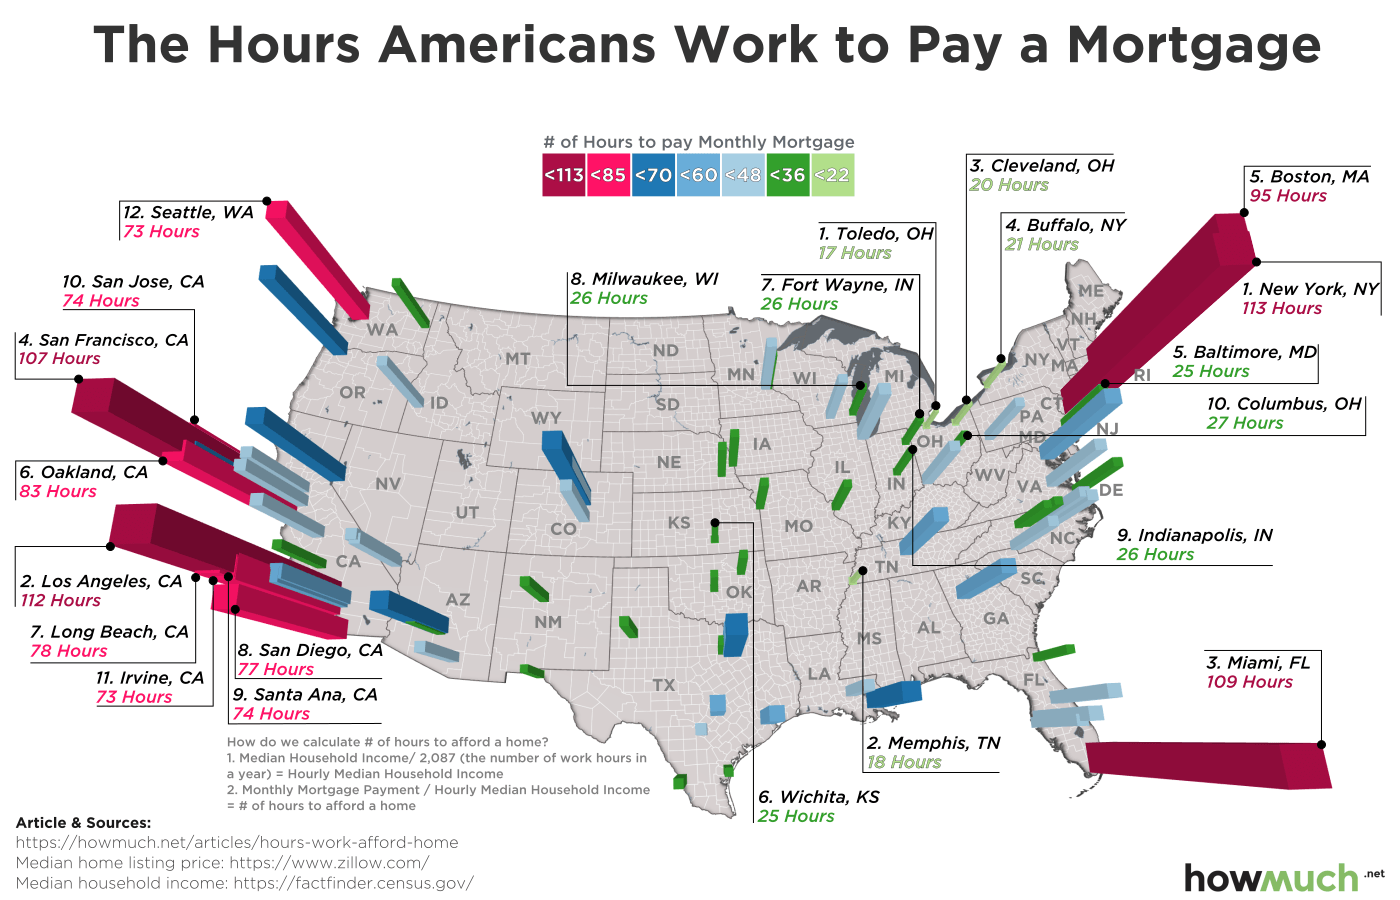
This week’s dataset is about how many hours residents need to work to pay for the monthly mortgage in major US cities. Hours to work = Median Home Listing Price * 30-year Fixed Mortgage Rate (Monthly) / Median Household Income in Hour.
It’s not surprising to see SF among one of the cities with most hours required :(
Below is the original viz, which you can find here. Basically, it’s a 3D bar chart on map. It’s interesting to visualize the size as buildings, as the data is about housing. Though the 3D views make it a little bit hard to compare among the cities.

My Visualization
This week I tried to incorprate the basic linear regression functionality in Tableau to the viz. I added a trendline with y = Median Home Listing Price, and x = Median Household Income. Tableau used simple linear regression to fit it. Then I calculated the predicted residuals (y-actual - y-pred), and put it on the color card to show how the home listing is overpriced or underpriced comparing to the general level in the US.
–
Please notice that all the visualizations are designed for desktop view, so it is recommended to view them on a desktop device.
–
Insights
- SF is the city with highest Median Home Listing Price, and also the most overpriced city, based on the simple linear regression. The other most overpriced cities are NY, LA, Boston, and Miami;
- Gilbert, Arizona has the most underpriced home listing against its income level;
- California has many of the most expensive cities to mortgage a house, and the same group of cities also have highest household income level.
Follow this link to find more weekly vizzes :)

