
Household Income Needed to Afford a Mortgage
Household Income Needed to Afford a Mortgage
The dataset I am visualizing this week is a from Zillow’s recent study on home affordability. It has detailed data on the income needed to afford a home mortage in Jan 2024 in 50 US metropolitan areas, and the years to save a 10% down payment based on the median household income in that area.
My Visualization
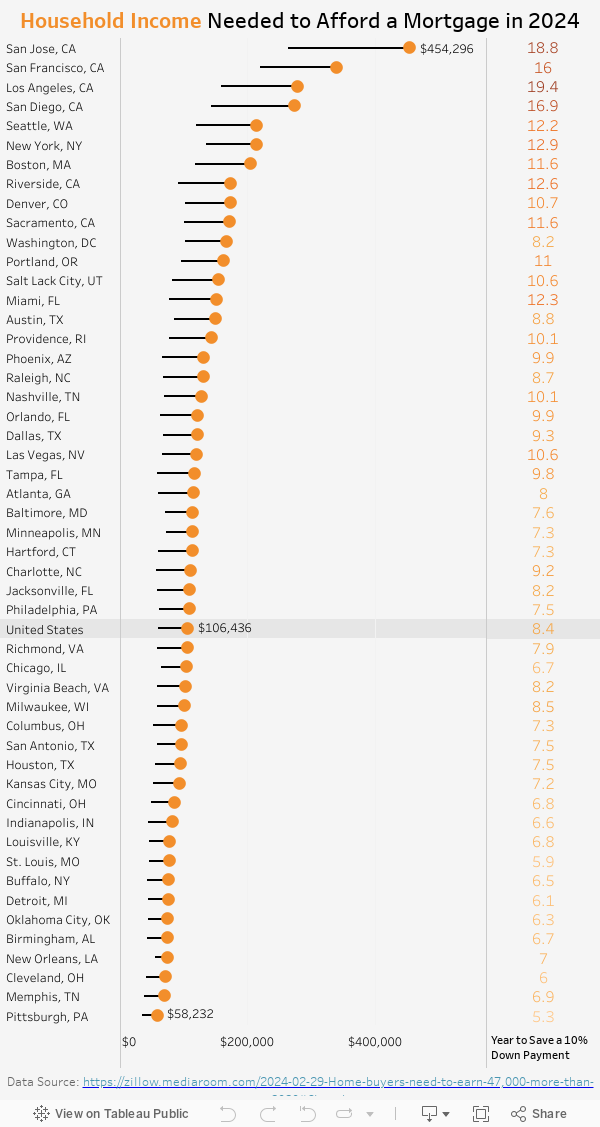
The visualization consists of two parts – On the left is a gantt chart that shows the income needed to afford a home mortgage in Jan 2024 (the organge dot) and how much it has increased since Jan 2020 (the black line); On the right is the years to save a 10% down payment in each metro.
Please notice that all the visualizations are designed for desktop view, so it is recommended to view them on a desktop device.
Insights
- Ranked by the income needed to afford a home mortgage, 6 of the top 10 metropolitan areas are in California;
- San Jose is the most expensive metro, whose income needed to afford a home mortgage is 33% higher than the 2nd place (San Francisco); But it is not the area with the longest year to save a 10% mortgage given San Jose has a relatively high median household income;
Follow this link to find more weekly vizzes :)
