3 minute read

Starting from Jan 08, 2018, I decide to put aside one hour on Monday weekly to create some visualization and find some insights from the data.

MakeoverMonday is a social data project: “Each week we post a link to a chart, and its data, and then you rework the chart. Maybe you retell the story more effectively, or find a new story in the data. We’re curious to see the different approaches you all take. Whether it’s a simple bar chart or an elaborate infographic, we encourage everyone of all skills to partake. Together we can have broader conversations about and with data.”

The datasets are published each week at: MakeoverMonday Datasets.

Please notice that all the visualizations are designed for desktop view, so it is recommended to view them on a desktop device. You can also find all vizzes in my Tableau Gallery.
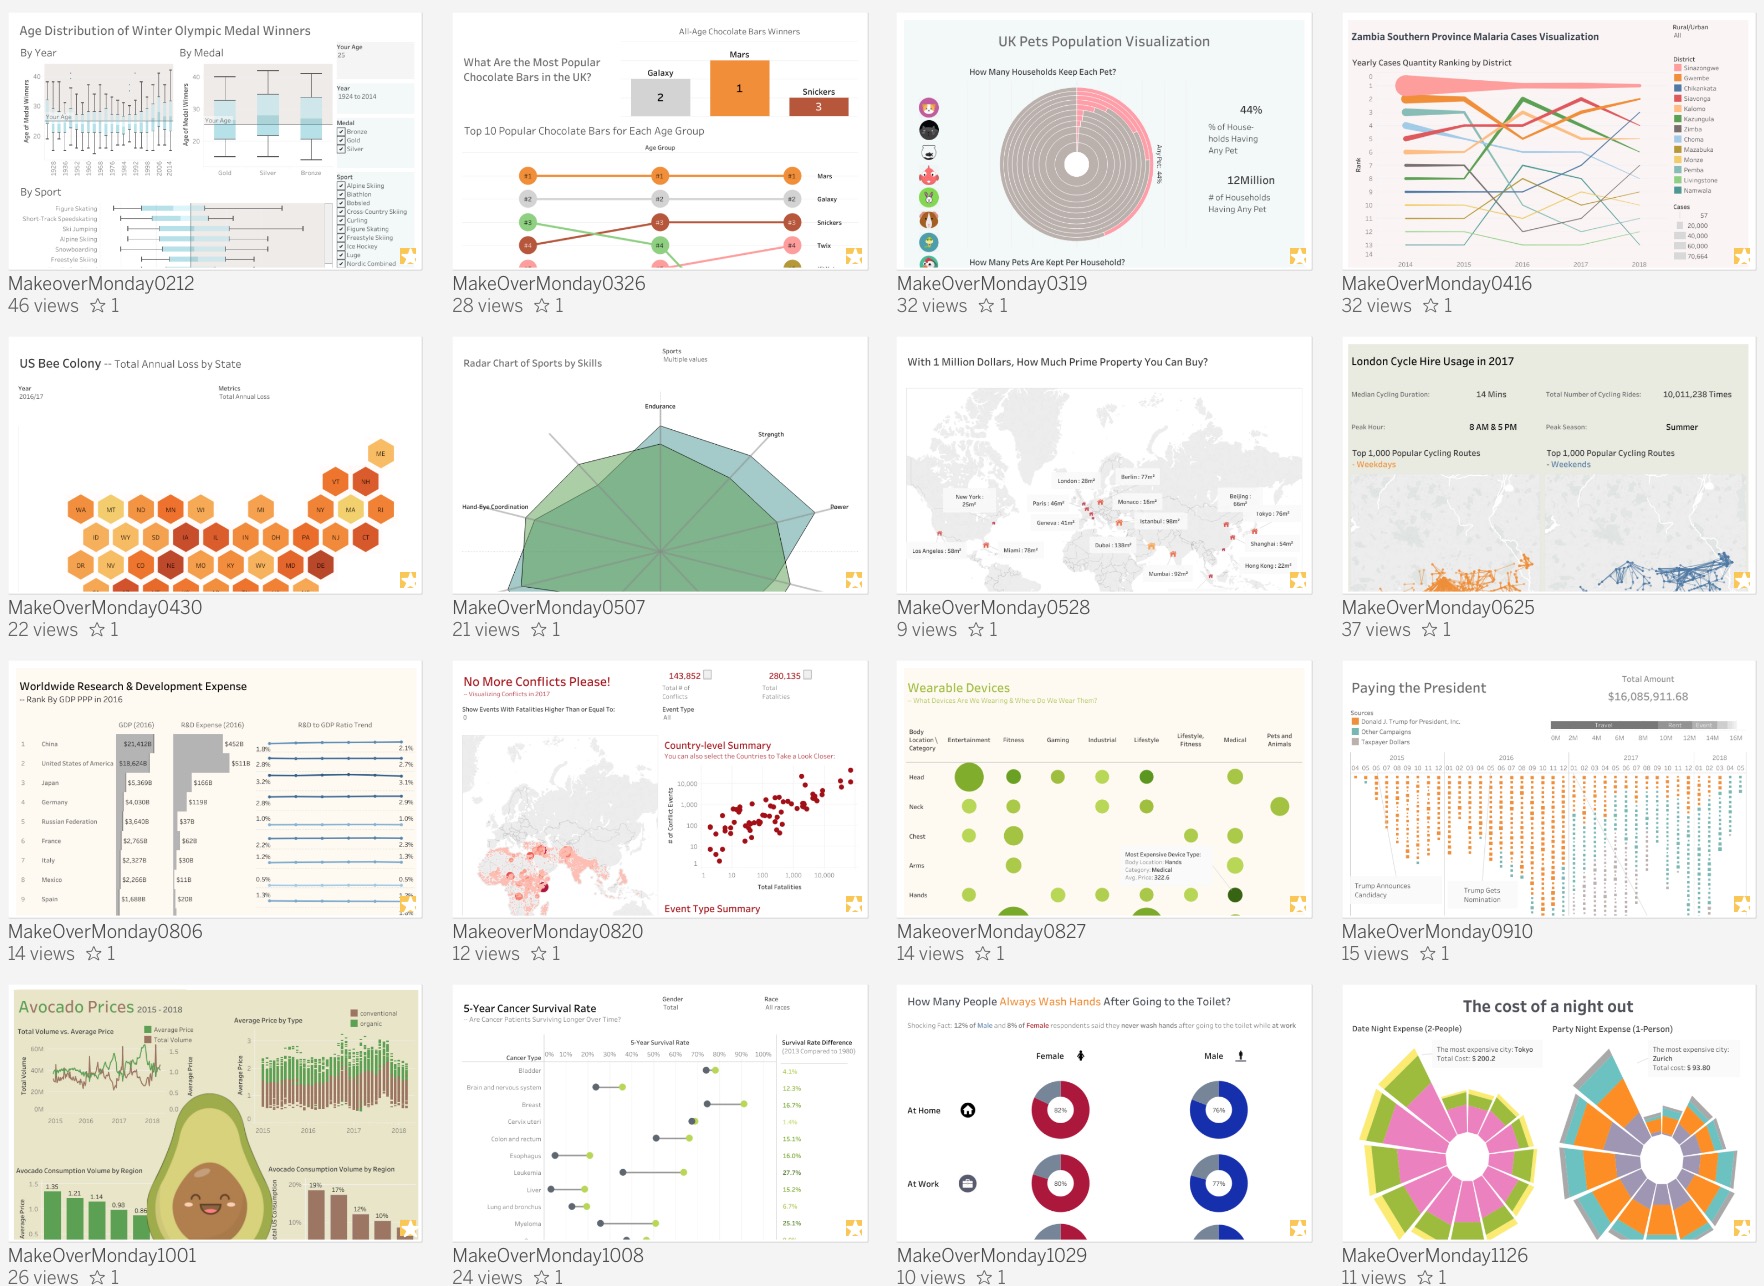
Week Date Topic Data Source
53 20181231 NHL Attendance ESPN
52 20181227(make up 20180101) U.S. Per Capita Consumption of Poultry and Livestock National Chicken Council
51 20181224 Average spending on Christmas gifts in the U.S. 1999-2018 Statista
50 20181217 London Bus Safety Performance TFL
49 20181210 Land Use by Food Type Our World in Data
48 20181203 Women Constructors in the Shortz Era XWord Info
47 20181126 The Cost of A Night Out UBS
46 20181119 How Many Hours Americans Need to Work to Pay Their Mortgage howmuch.net
45 20181112 Diversity in Tech Company and Press Reports
44 20181105 US Population Projection by Age Group 2016-2060 United States Census Bureau
43 20181029 Washing Hands After Going to the Toilet YouGov
42 20181022 Beer Cost at Every MLB Stadium Team Marketing Report
41 20181015 Total Number of Women the House of Representatives: 1917-2018 Congressional Research Service
40 20181008 5-Year Cancer Survival Rates in US Our World in Data
39 20181001 Avocado Prices Hass Avocado Board
38 20180924 Visualzing Equality EM 2030
37 20180917 Train Versus Plane in Europe DW Data
36 20180910 Paying the President ProPublica
35 20180903 Nike Factory Locations Nike Inc.
34 20180827 Wearable Devices Figure Eight
33 20180820 ACLED: Visualizing Conflict ACLED
32 20180813 Anthony Bourdain’s Travels @ChristineZhang
31 20180806 How Much Your Country Spends on Research & Development UNESCO Institute for Statistics
30 20180730 Big Mac Index The Economist
29 20180723 OECD Parental Leave System OECD
28 20180716 Historical NBA Team Spending Against the Cap CeltsHub
27 20180709 Volcano Eruptions Global Volcanism Program
26 20180702 Rat Sightings in NYC NYC Open Data
25 20180625 London Cycle Hire Usage Transport for London
24 20180618 U.S. Influenza Surveillance Report CDC
23 20180611 Tourism Density Index Intrepid Travel
22 20180604 UK Gender Gap GOV.UK
21 20180528 The World’s Most Expensive Prime Property WeForum
20 20180521 Premier League Rank Prediction Vesus Reality The Guardian
19 20180514 Traffic Jam in Europe Euronews
18 20180507 Toughest Sport by Skill ESPN
17 20180430 Bee Colony Loss in the US BeeInformed
16 20180423 Ecological Footprint per Capita Global Footprint Network
15 20180416 Zambia Southern Province Confirmed Malaria Cases Simulated data from http://visualizenomalaria.org, contact jdrummey@path.org for data question
14 20180409 Arctic Sea Ice Extent National Snow & Ice Data Center
13 20180402 World Wine Production International Organisation of Vine and Wine
12 20180326 Top 10 Popular Chocolate Bar Brands in the UK CDA
11 20180319 UK Pet Population Pet Food Manufacturer’s Association
10 20180312 Growth in Irish Whiskey Sales Board Bia via The IWSR
9 20180305 Survey on Gender Equality Measurements Awareness of Policymakers in Five Countries Equal Measures 2030
8 20180226 World Economic Freedom Fraser Institute
7 20180219 World Drugs and Medicine Trade TradeMap.org
6 0180212 The Winter Olympics Sports-Reference.com
5 20180205 US Baseball Players Ethnicity SABR.org
4 20180129 Most Profitable Companies TitleMax
3 20180122 Movement of Turkey Vultures in North and South America Movebank.org
2 20180115 U.S. Household Income Distribution by State US Census Bureau
1 20180108 Across the globe, personality is rated as more important than looks YouGov