3 minute read

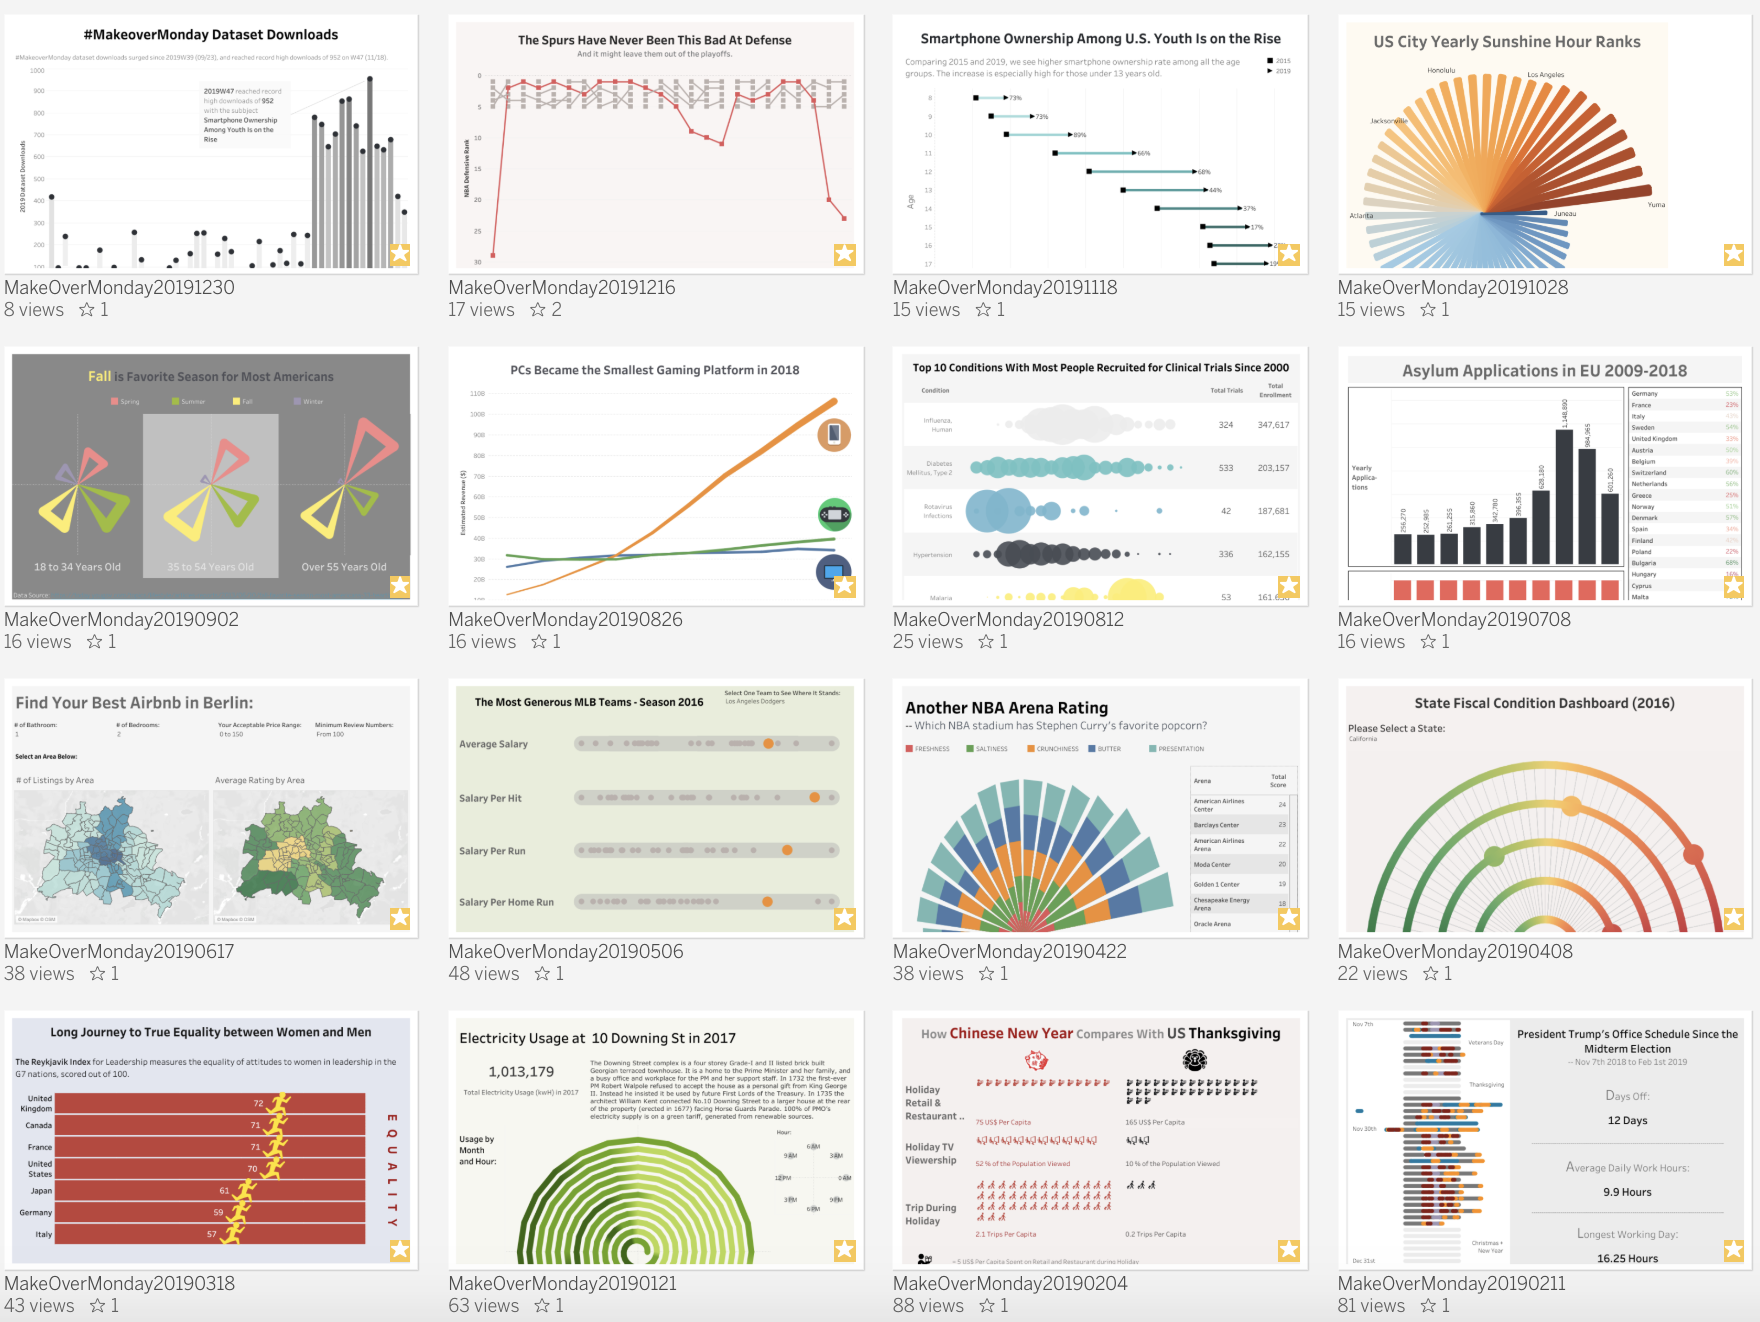
Throughout 2019, I have been putting aside one hour every Monday to work on my Tableau visualizations following the Makeovermonday project.

MakeoverMonday is a social data project: “Each week we post a link to a chart, and its data, and then you rework the chart. Maybe you retell the story more effectively, or find a new story in the data. We’re curious to see the different approaches you all take. Whether it’s a simple bar chart or an elaborate infographic, we encourage everyone of all skills to partake. Together we can have broader conversations about and with data.”

Starting from Jan 08, 2018, I decide to put aside one hour on Monday weekly to create some visualization and find some insights from the data.

The datasets are published each week at: MakeoverMonday Datasets.

Please notice that all the visualizations are designed for desktop view, so it is recommended to view them on a desktop device. You can also find all vizzes in my Tableau Gallery.

Week Date Topic Data Source
105 20191230 The Most Popular Makeover Monday Topics data.world
104 20191223 Estimated Christmas spending by concept Deloitte Christmas Survey 2019
103 20191216 The Spurs Have Never Been This Bad At Defense – NBA Defensive Ratings NBA
102 20191209 Ranked: Biggest Fast Food Chains in America Visual Capitalist
101 20191202 How much does union membership benefit America’s workers? Bureau of Labor Statistics
100 20191125 2018 Central Park Squirrel Census Fur Map NYC Open Data
99 20191118 Smartphone Ownership Among Youth Is on the Rise Common Sense (page 27)
98 20191111 Youth and Adult Literacy Rates UNESCO SDG4
97 20191104 Las Vegas Convention Attendance & Visitor Traffic: Jan 1970-Oct 2019 Las Vegas Convention and Visitors Authority
96 20191028 World Cities Ranked by Average Annual Sunshine Hours Wikipedia
95 20191021 The age at which most people are dying by suicide Office for National Statistics
94 20191014 Ironman World Championship Medalists Wikipedia
93 20191007 Donations accepted by political parties The Electoral Commission
92 20190930 London Population Predictions London Datastore
91 20190923 Evictions in San Francisco DataSF
90 20190916 Positive Impact Events – Committments from the Event Industry for the Sustainable Development Goals MyWorld2030 Events Survey
89 20190909 James Patterson Book Checkouts at Seattle Libraries Seattle Open Data
88 20190902 Fall is favorite season for most Americans YouGov
87 20190826 PCs to Become the Smallest Gaming Platform in 2018 Statista
86 20190819 Americans touch their smartphones 2,617 times a day Pew Research Center
85 20190812 A bird’s-eye view of clinical trials Aero Data Lab
84 20190805 The power switch: tracking Britain’s record coal-free run Gridwatch
83 20190729 STD Infections Rates in America CDC
82 20190722 Arsenal FC’s 2018/19 season Premier League Stat Center
81 20190715 The share of Americans not having sex has reached a record high General Social Survey
80 20190708 Asylum Applications in EU Eurostsat
79 20190701 Game of Thrones Deaths David Murphy
78 20190624 Alcohol Consumption By Country World Atlas
77 20190617 Berlin Airbnb Ratings Inside Airbnb
76 20190610 Is it wrong for same-sex couples to have sexual relations? GSS Data Explorer
75 20190603 Sleepless in America? American Time Use Survey
74 20190527 CO2 emissions per capita World Bank
73 20190520 North American Bear Attacks Wikipedia
72 20190513 Rhino Poaching in South Africa Department of Environmental Affairs
71 20190506 Major League Baseball Most Efficient Batters Lahman’s Baseball Database
70 20190429 ISS Spacewalks NASA
69 20190422 Steph Curry’s Stadium Popcorn Rankings Stephen Curry
68 20190415 The words in ‘Info We Trust’ RJ Andrews (Author)
67 20190408 Ranking the States by Fiscal Condition Mercatus Center
66 20190401 Wastes on UK Beaches Great British Beach Clean Report 2017
65 20190325 Consumer Spending by Generation Bank of America Merrill Lynch
64 20190318 How do we really feel about women leaders? The Reykjavik Index for Leadership
63 20190311 Philadelphia Real Estate Transfers OpenDataPhilly
62 20190304 World Development Indicators – Health and Equality World Bank
61 20190225 Economic value of the bicycle industry SQW
60 20190218 Which States Produce the Most Wind Energy American Wind Energy Association via Choose Engery
59 20190211 Trump’s “Executive Time” Axios
58 20190204 How Chinese New Year Compares With Thanksgiving Bloomberg via Statista
57 20190128 Digital Economy and Society Index (DESI) European Commission
56 20190121 Energy Use at 10 Downing Street CarbonCulture
55 20190114 How many people earned the Federal minimum wage or less in each State? Bureau of Labor Statistics
54 20190107 Press Freedom’s Dark Horizon Freedomhouse.org

(index starts from my first #Makeoovermonday viz in 2018)