
My 2022 Weekly Vizzes
This is my fifth year of this weekly visualization initiative ;) The goal is to find some fun datasets, visualize them in some fun (or boring) ways, and extract some fun insights.
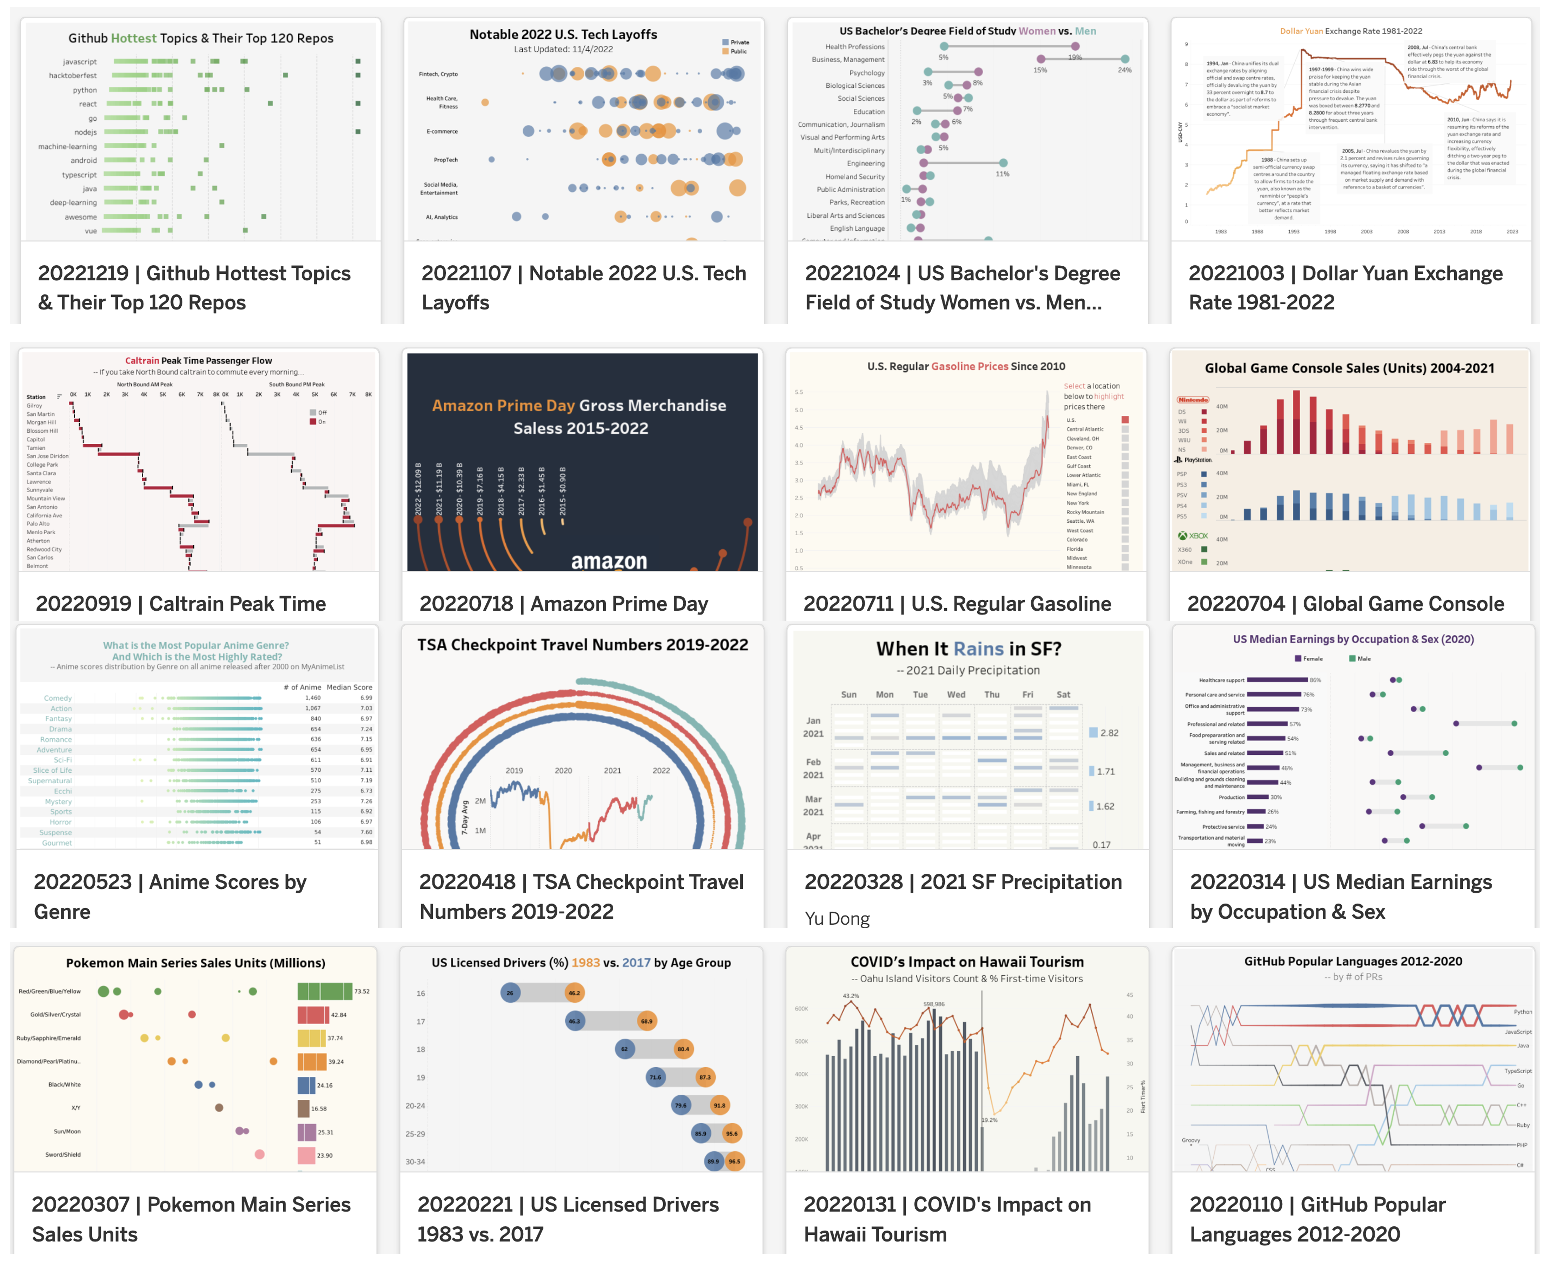
Please notice that all the visualizations are designed for desktop view, so it is recommended to view them on a desktop device. You can also find all the vizzes in my Tableau Gallery.
(index starts from my first #Makeoovermonday viz in 2018)
Check out visualizations from the last year: Weekly Viz 2021

