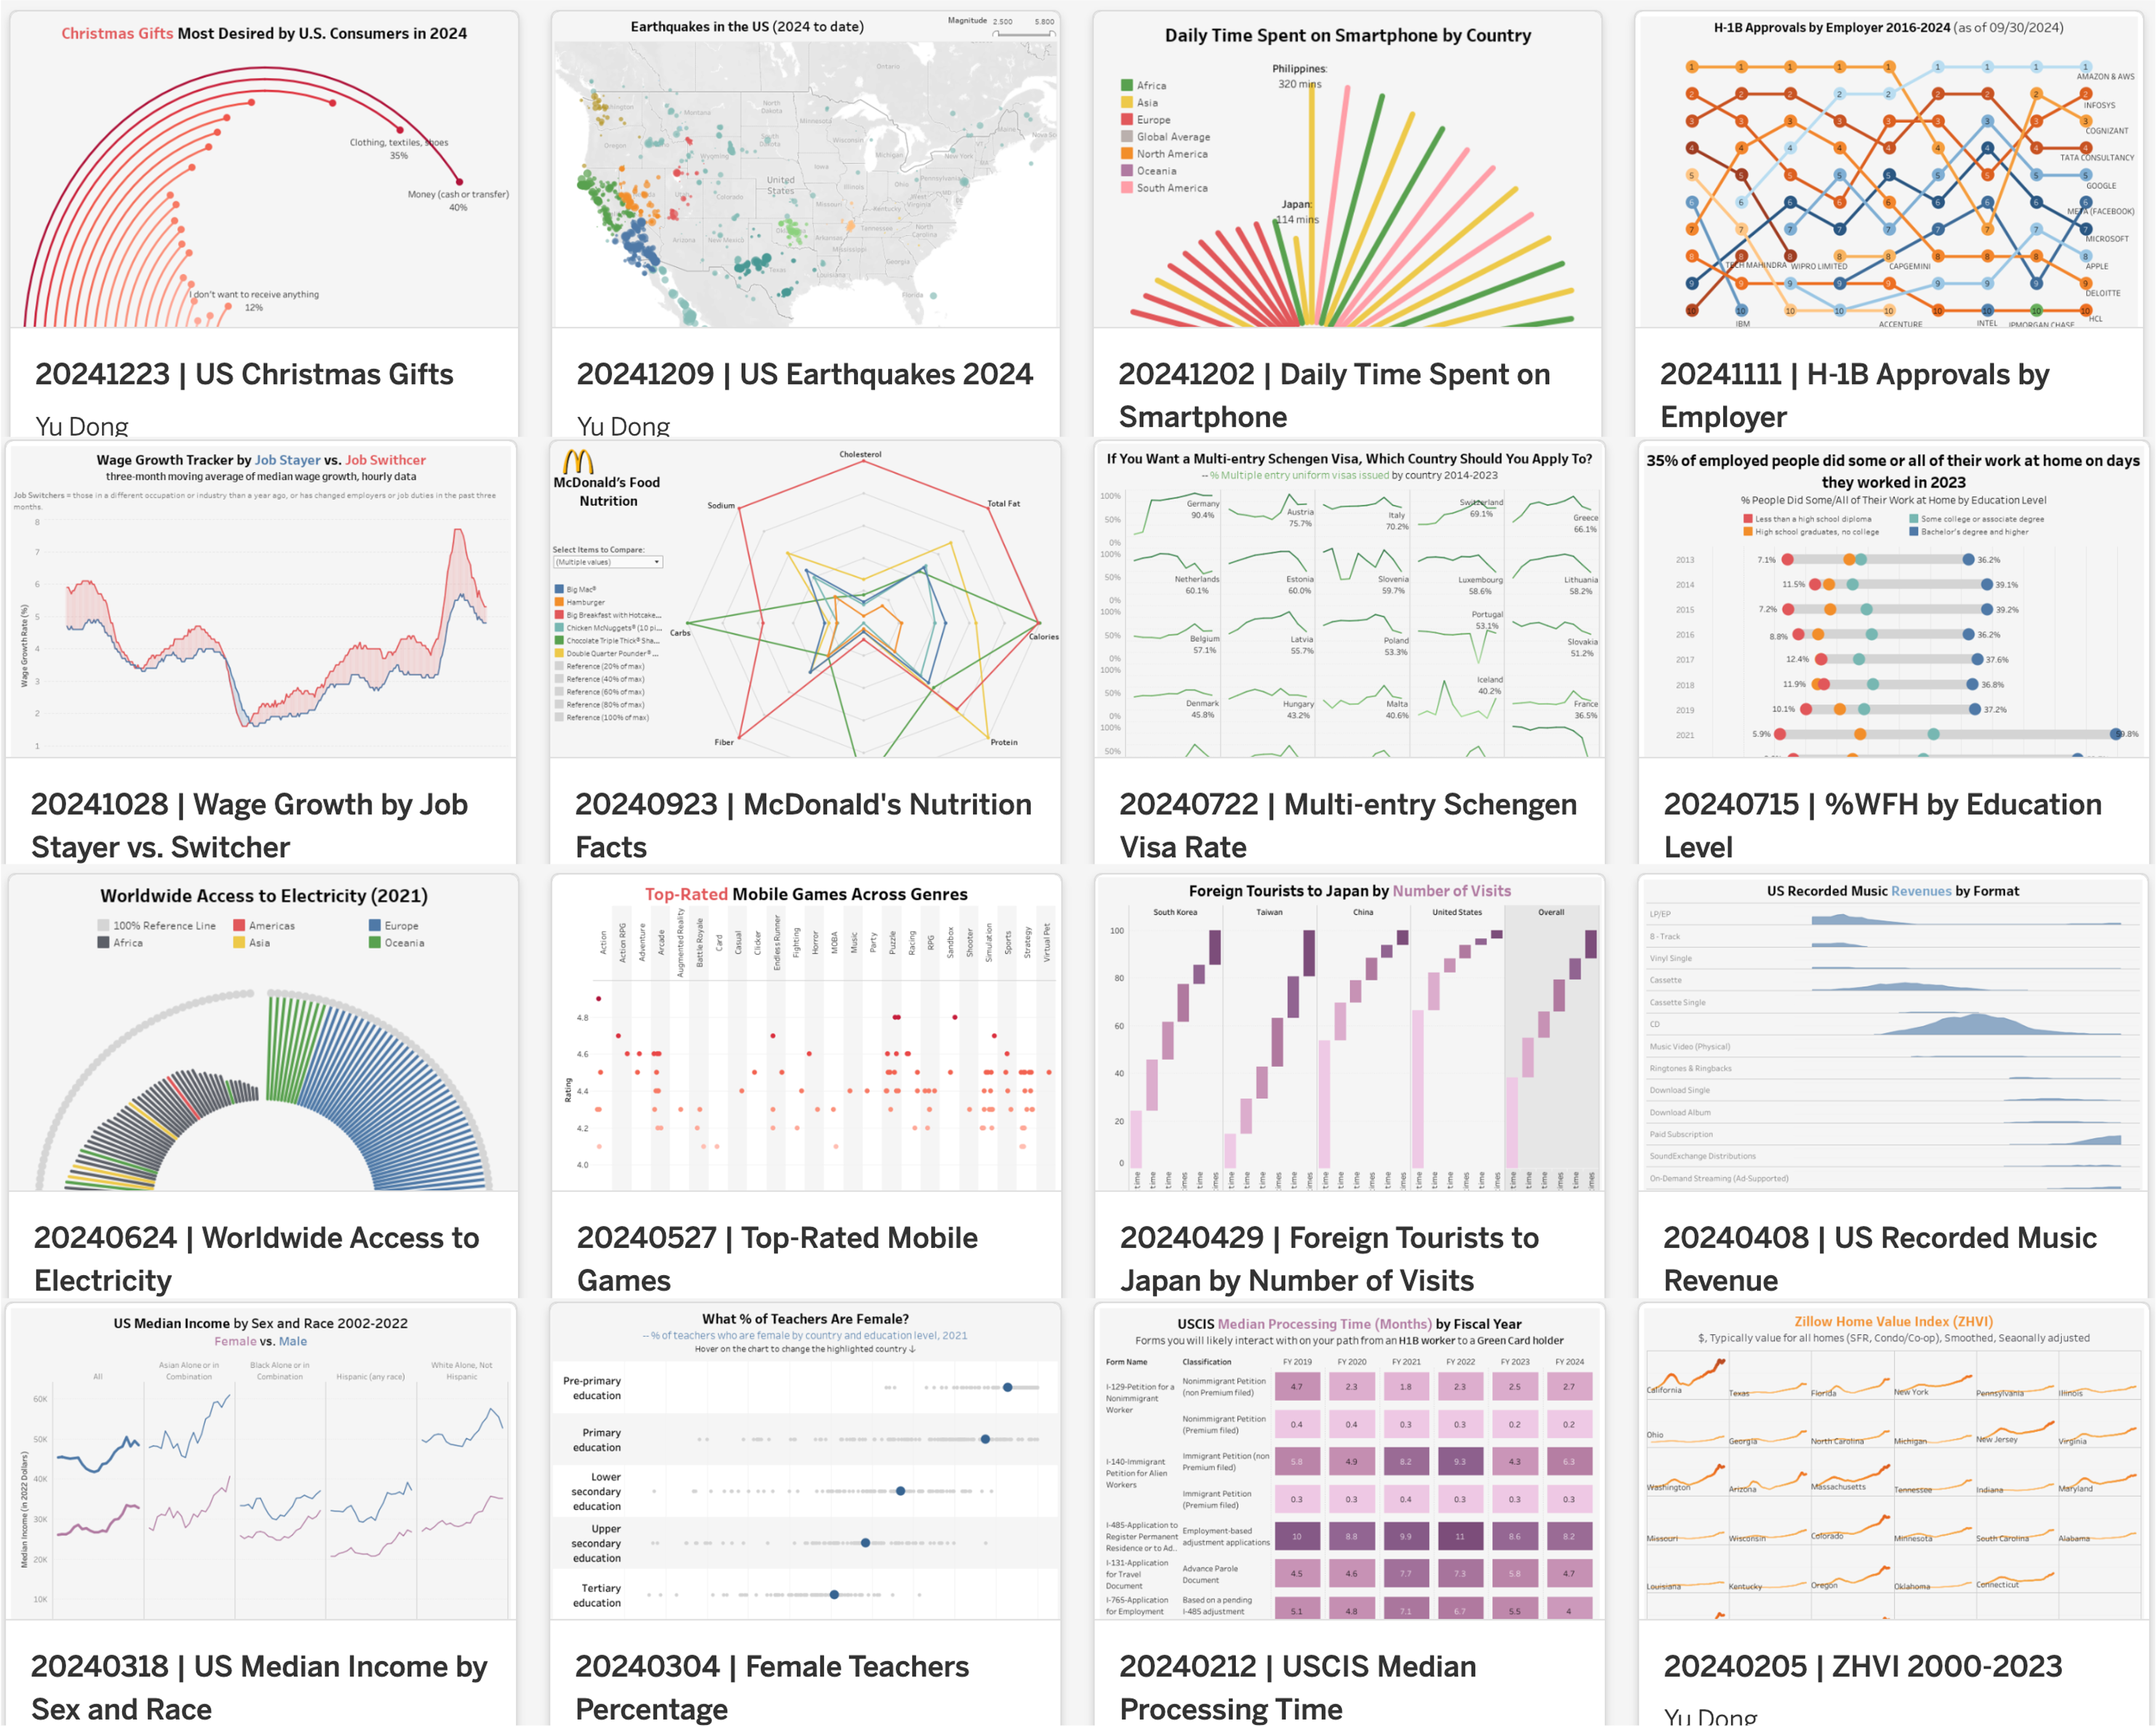
| 366 |
20241230 |
US Air Travelers 2023 vs. 2024 |
TSA |
| 365 |
20241223 |
US Christmas Gifts |
Statista |
| 364 |
20241216 |
Tourists Nights Spent in EU |
Eurostat |
| 363 |
20241209 |
US Earthquakes 2024 |
USGS |
| 362 |
20241202 |
Daily Time Spent on Smartphone |
Exploding Topics |
| 361 |
20241125 |
Holiday Sales Spend |
YouGov |
| 360 |
20241118 |
Number of Public Holidays |
World Population Review |
| 359 |
20241111 |
H-1B Approvals by Employer |
USCIS |
| 358 |
20241104 |
US Job Openings 2019-2024 |
US Bureau of Labor Statistics |
| 357 |
20241028 |
Wage Growth by Job Stayer vs. Switcher |
Federal Reserve Bank of Atlanta |
| 356 |
20241021 |
Interests in Pokemon Sleep |
Statista |
| 355 |
20241014 |
AI Use Case Sentiments |
Forbes Advisor |
| 354 |
20241007 |
US Office Visit Recovery Rate |
Axios |
| 353 |
20240930 |
US Business Applications |
FRED |
| 352 |
20240923 |
McDonald's Nutrition Facts |
Kaggle |
| 351 |
20240916 |
U.S. Social Media Platform Usage |
Pew Research Center |
| 350 |
20240909 |
Swiss Public Transportation Usage |
Swiss Federal Statistical Office |
| 349 |
20240902 |
Monthly Job Openings Rate |
US Bureau of Labor Statistics |
| 348 |
20240826 |
Monthly Unemployed by Reason |
US Bureau of Labor Statistics |
| 347 |
20240819 |
Average Tech Salary in 2023 |
Dice |
| 346 |
20240812 |
US Income Inequality by Ethnicity |
Pew Research Center |
| 345 |
20240805 |
Summer Olympic Gold Medals |
Kaggle |
| 344 |
20240729 |
Olympic Medals vs. GDP |
Wikipedia |
| 343 |
20240722 |
Multi-entry Schengen Visa Rate |
European Commission |
| 342 |
20240715 |
% People Working at Home by Education Level |
US Bureau of Labor Statistics |
| 341 |
20240708 |
US Monthly Electricity Generation |
U.S. Energy Information Administration |
| 340 |
20240701 |
Desktop vs. Mobile vs. Tablet Market Share 2010 - 2023 |
statcounter |
| 339 |
20240624 |
Worldwide Access to Electricity |
World Bank |
| 338 |
20240617 |
US Transportation Habits |
YouGov |
| 337 |
20240610 |
My Favorite Visualization Topics |
My blog :) |
| 336 |
20240603 |
My Favorite Visualization Types |
My blog :) |
| 335 |
20240527 |
Top-Rated Mobile Games |
Kaggle |
| 334 |
20240520 |
French People's Confidence in Paris Olympics |
Datawrapper |
| 333 |
20240513 |
Median Weekly Earnings 24Q1 |
US Bureau of Labor Statistics |
| 332 |
20240506 |
Visitor Arrivals to Japan Yearly 1964-2023 |
Japanese Tourism Statistics |
| 331 |
20240429 |
Foreign Tourists to Japan by Number of Visits |
Japanese Tourism Statistics |
| 330 |
20240422 |
New Business 1-Year Survival Rates |
US Bureau of Labor Statistics |
| 329 |
20240415 |
Pending Employment-based Immigration Petitions |
USCIS |
| 328 |
20240408 |
US Recorded Music Revenue |
The Recording Industry Association of America |
| 327 |
20240401 |
Household Income Needed to Afford a Mortgage |
Zillow |
| 326 |
20240325 |
Bay Area Information Industry Employment |
California Open Data Portal |
| 325 |
20240318 |
US Median Income by Sex and Race |
US Census Bureau |
| 324 |
20240311 |
Job Postings on Indeed |
FRED |
| 323 |
20240304 |
Female Teachers Percentage |
UNESCO |
| 322 |
20240226 |
International Visitors to Japan |
Japan National Tourism Organization |
| 321 |
20240219 |
Travel Accommodation Revenue Share |
Statista |
| 320 |
20240212 |
USCIS Median Processing Time |
USCIS |
| 319 |
20240205 |
Zillow Home Value Index 2000-2023 |
Zillow |
| 318 |
20240129 |
The Most Popular Hotel Brands |
YouGov |
| 317 |
20240122 |
Americans' New Year Resolutions |
YouGov |
| 316 |
20240115 |
Anime Rating Jan 2024 |
MyAnimeList |
| 315 |
20240108 |
Operating System Market Share 2009-2023 |
Statcounter |
| 314 |
20240101 |
SFPD Stops 2018-2023 |
DataSF |