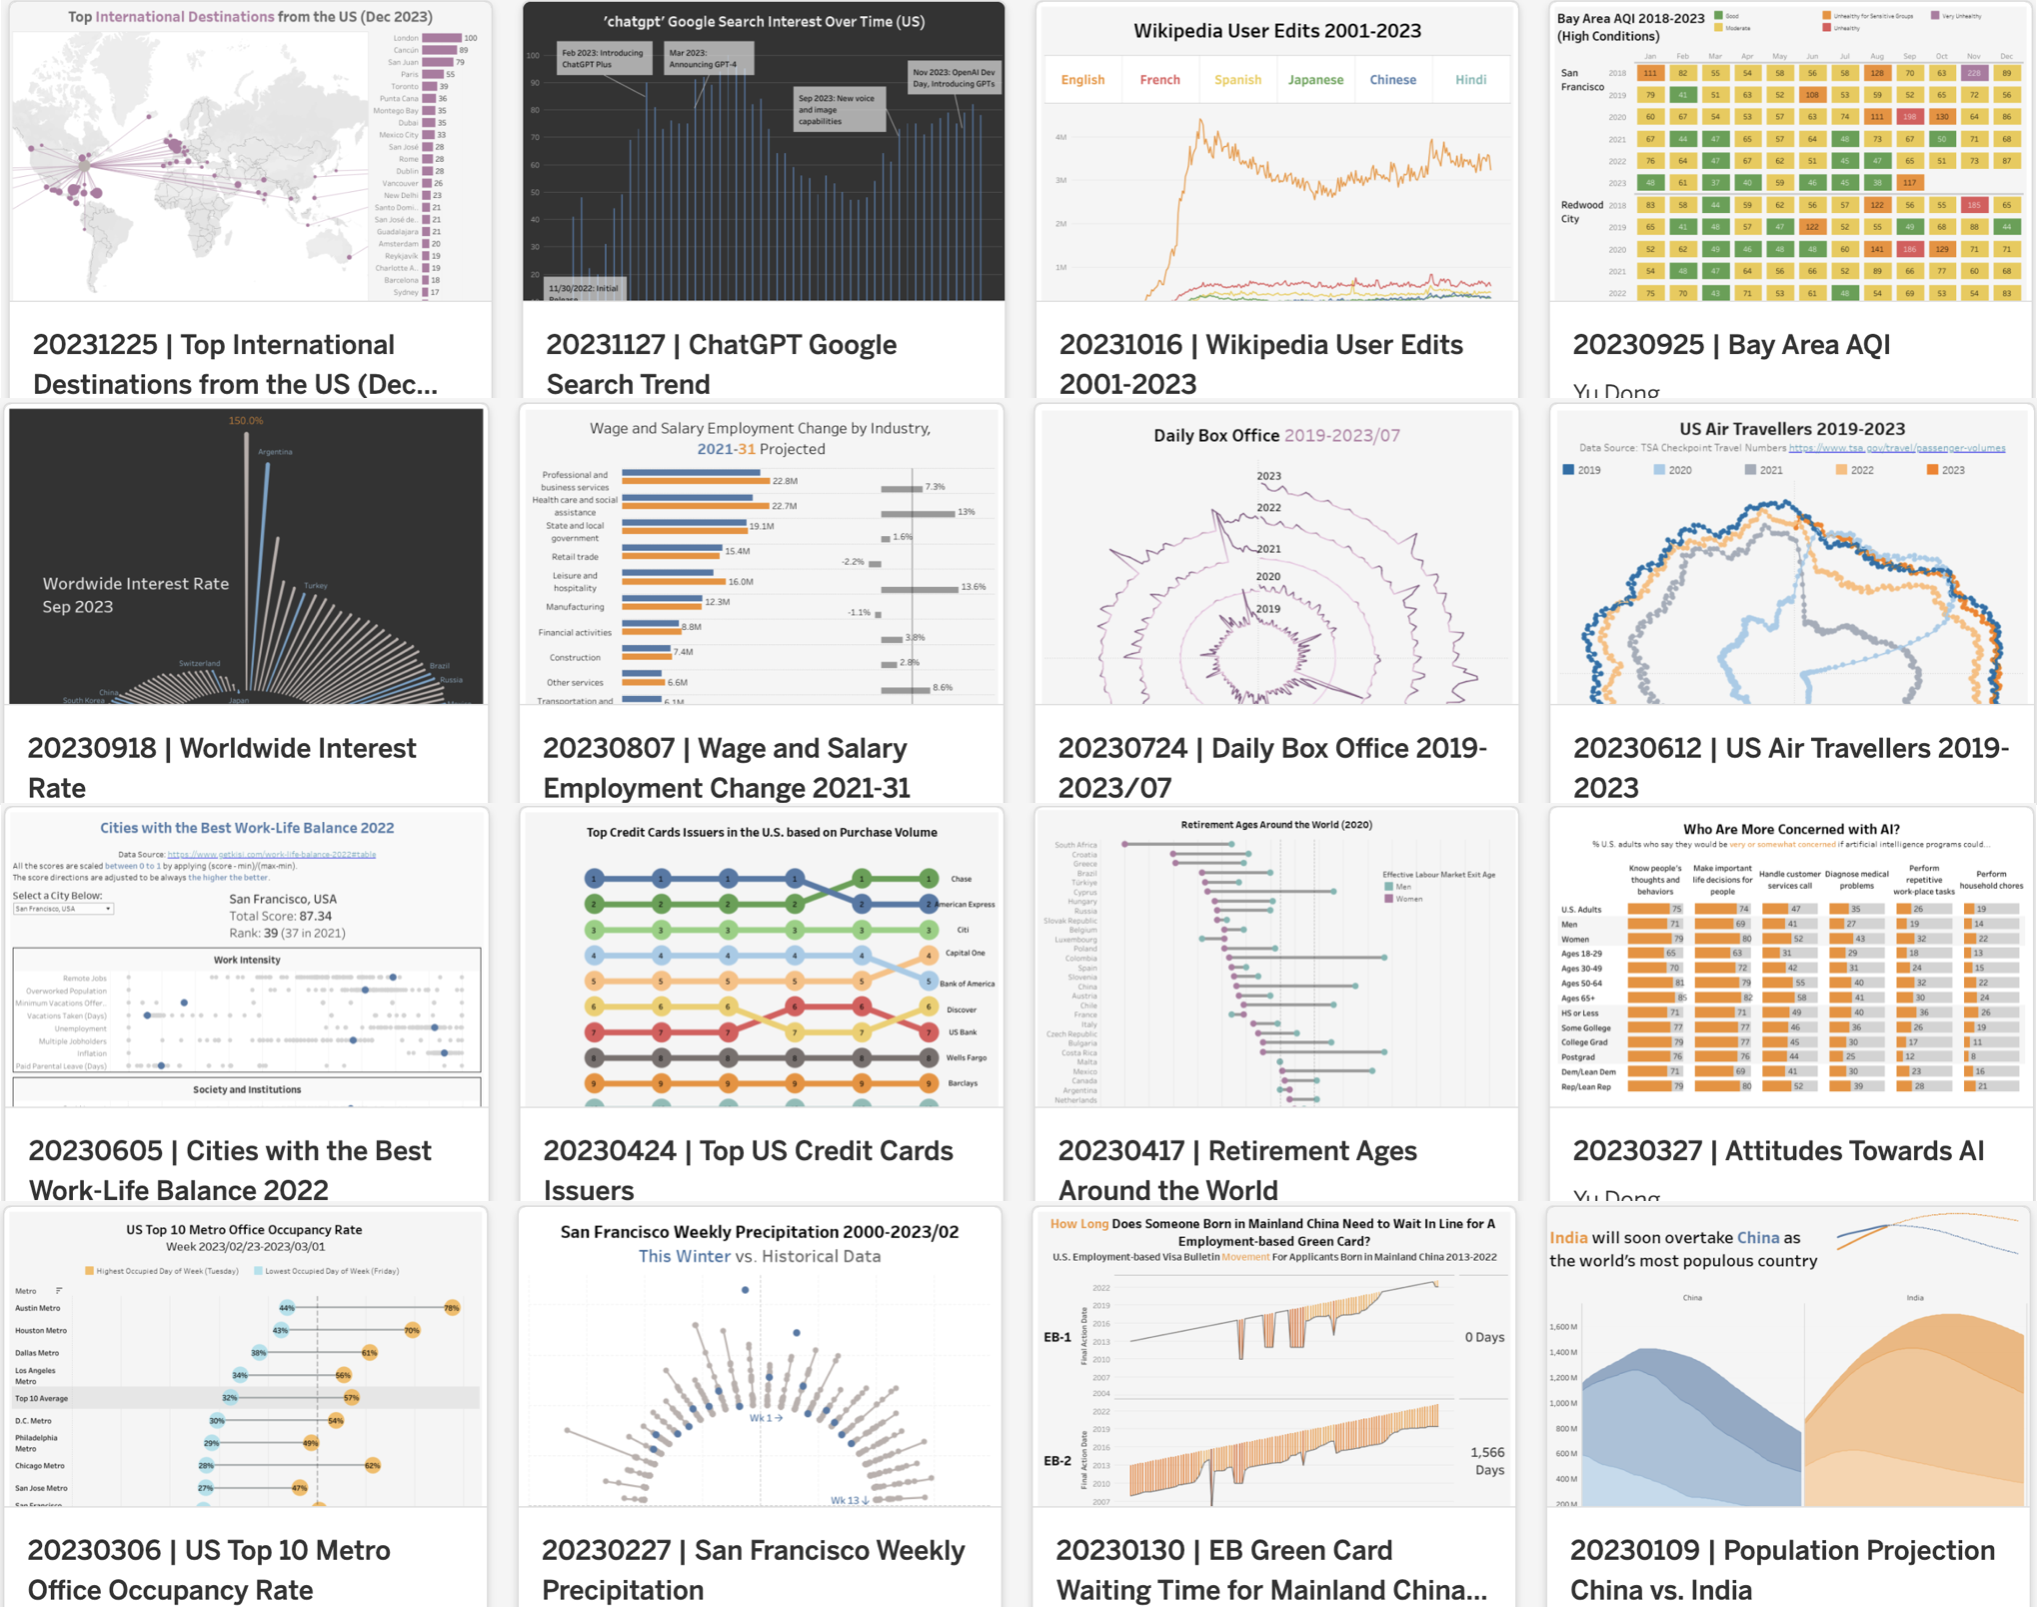
| 313 |
20231225 |
Top International Destinations from the US (Dec 2023) |
Destination Insights with Google |
| 312 |
20231218 |
Holiday Discounts 2023 |
Adobe Analytics |
| 311 |
20231211 |
US Green Card Issuance 2013-2022 |
US Department of Homeland Security |
| 310 |
20231204 |
Women in Healthcare |
US Bureau of Labor Statistics |
| 309 |
20231127 |
ChatGPT Google Search Trend |
Google Trends |
| 308 |
20231120 |
Tech Layoffs 2022-2023 |
layoffs.fyi |
| 307 |
20231113 |
Weekly Wage Changes by State |
US Bureau of Labor Statistics |
| 306 |
20231106 |
US Non-cash Payment Methods |
Federal Reserve |
| 305 |
20231030 |
Airline Domestic Market Share |
Bureau of Transportation Statistics |
| 304 |
20231023 |
Household Spending by Income Quintile 2022 |
Bureau of Transportation Statistics |
| 303 |
20231016 |
Wikipedia User Edits 2001-2023 |
Wikimedia Statistics |
| 302 |
20231009 |
Most Popular Languages Worldwide |
Class Tracks |
| 301 |
20231002 |
Average Bedtime by Country |
World Population Review |
| 300 |
20230925 |
Bay Area Air Quality 2018-2023 |
Bay Area Air Quality Management District |
| 299 |
20230918 |
Worldwide Interest Rate |
Trading Economics |
| 298 |
20230911 |
Cruise Passengers 2009-2027 |
Statista |
| 297 |
20230904 |
U.S. Personal Savings Rate |
FRED |
| 296 |
20230828 |
U.S. Adults' View on Alcohol |
Gallup |
| 295 |
20230821 |
Energy Use Per Person 1965-2022 |
Our World In Data |
| 294 |
20230814 |
S&P Companies Citing AI on Earning Calls |
FactSet |
| 293 |
20230807 |
Wage and Salary Employment Change 2021-31 |
US Bureau of Labor Statistics |
| 292 |
20230731 |
AI Exposure and Wage |
Pew Research Center |
| 291 |
20230724 |
Daily Box Office 2019-2023/07 |
BoxOfficeMojo.com |
| 290 |
20230717 |
Recovery of Bay Area Weekday Transit Ridership |
Bay Area Council Economic Institute |
| 289 |
20230710 |
Attitudes Towards AI-based Text Generation |
YouGov |
| 288 |
20230703 |
Favorite Social Media among US Teens |
Pew Research Center |
| 287 |
20230626 |
Students Reading For Fun |
The Nation's Report Card |
| 286 |
20230619 |
The Most Used Language On The Internet |
Rest of World |
| 285 |
20230612 |
US Air Travellers 2019-2023 |
TSA |
| 284 |
20230605 |
Cities with the Best Work-Life Balance 2022 |
kisi |
| 283 |
20230529 |
US Employment Occupation Distribution |
U.S. Bureau of Labor Statistics |
| 282 |
20230522 |
Stress Levels at Work |
American Psychological Association |
| 281 |
20230515 |
Zelda Main Series Sales |
Fandom |
| 280 |
20230508 |
Global Personal Luxury Goods Market |
Bain & Company |
| 279 |
20230501 |
First Republic Bank Failure |
Yahoo Finance |
| 278 |
20230424 |
Top US Credit Cards Issuers |
wallethub |
| 277 |
20230417 |
Retirement Ages Around the World |
OECD |
| 276 |
20230410 |
AI Capabilities Embedded in Businesses |
Stanford University |
| 275 |
20230403 |
Do Millennials Own or Rent Home |
Rentcafe |
| 274 |
20230327 |
Attitudes Towards AI |
Pew Research Center |
| 273 |
20230320 |
Credit Suisse vs. UBS Stock Price |
Yahoo Finance |
| 272 |
20230313 |
Global PE/VC Funding Round Investments 2022 |
S&P Global |
| 271 |
20230306 |
US Top 10 Metro Office Occupancy Rate |
Kastle Systems |
| 270 |
20230227 |
San Francisco Weekly Precipitation |
NOAA(National Oceanic and Atmospheric Administration) |
| 269 |
20230220 |
American's Trust in Mass Media is Declining Over Time |
Gallup |
| 268 |
20230213 |
US Search Engine Market Share Top 10 |
statcounter |
| 267 |
20230206 |
Which Country Gets the Most Paid Vacation Days |
resume.io |
| 266 |
20230130 |
EB Green Card Waiting Time for Mainland China Applicants |
Jackson & Hertogs |
| 265 |
20230123 |
Spring Festival Travel Rush |
Baidu Qianxi |
| 264 |
20230116 |
US Interstate Migration Pattern 2013-2022 |
the United Nations |
| 263 |
20230109 |
Population Projection China vs. India |
Atlas Van Lines |
| 262 |
20230102 |
US Consumers Excited for Holiday Shopping |
Mckinsey |


